
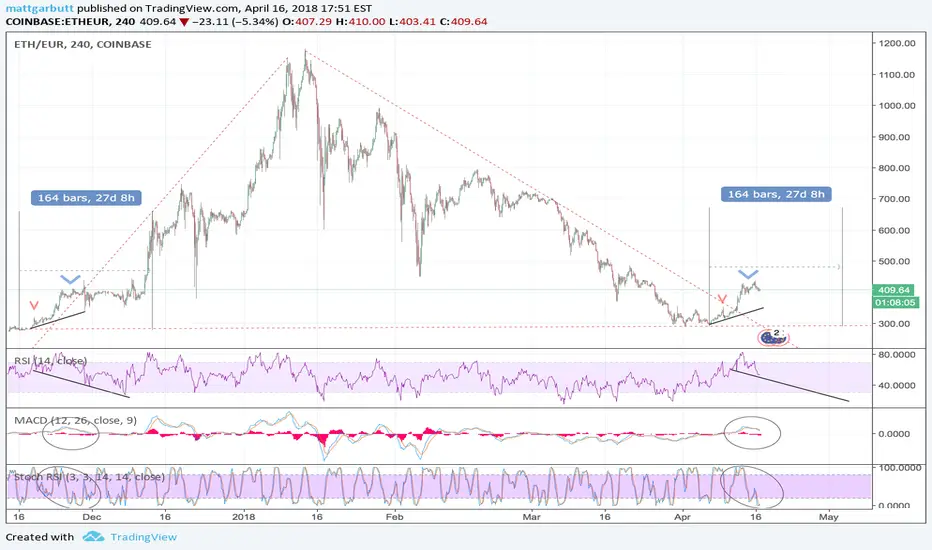
Was just noodling around on the ETH chart, and it suddenly struck me that the initial leg up in the last bubble is showing a very similar pattern to the one that we're in right now, with RSI, Stock and MACD also seemingly repeating history too.
I don't believe we're about to bubble up again for a single minute, simply wanted to put this up to see how it develops over the coming fortnight or so.
I don't believe we're about to bubble up again for a single minute, simply wanted to put this up to see how it develops over the coming fortnight or so.
注释
Logscale view with added trend line, showing where current resistance is - the same line as last November.RSI has continued its bearish divergence, MACD still in roughly the same shape as last time, heading for the zero line. Meanwhile, the Stoch has slightly broken from the previous pattern.

免责声明
这些信息和出版物并非旨在提供,也不构成TradingView提供或认可的任何形式的财务、投资、交易或其他类型的建议或推荐。请阅读使用条款了解更多信息。