
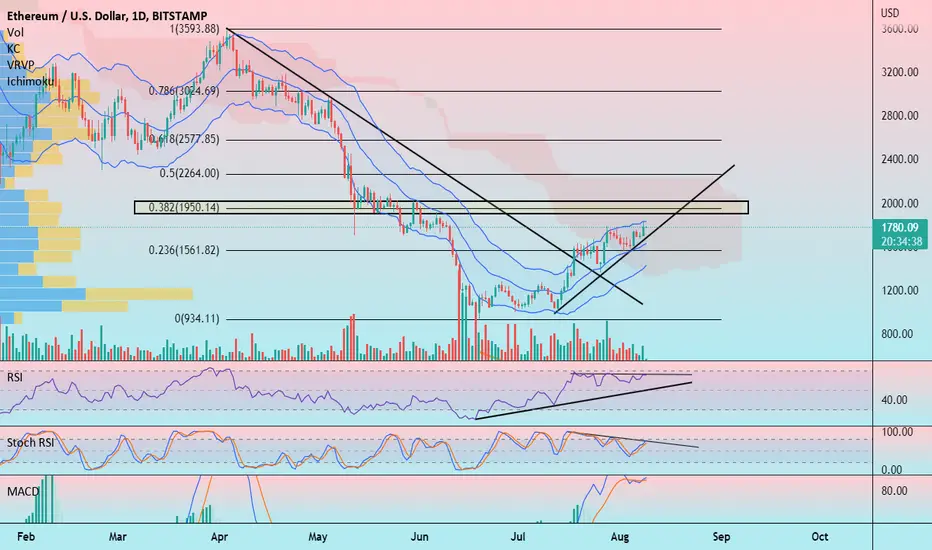
Hello friends, today you can review the technical analysis idea on a 1D linear scale chart for Ethereum (ETHUSD).
Ethereum price has been rising since the July lows. The chart shows a variety of signals with potential for upward movement around the resistance areas at the top of the Keltner Channel (KC) near the 0.382 Fibonacci level. A major concern is Volume dropping off.
Also Included: Fibonacci Retracement, RSI, MACD, Stochastic RSI, Ichimoku Cloud, and VPVR.
If you enjoy my ideas, feel free to like it and drop in a comment. I love reading your comments below.
Disclosure: This is just my opinion and not any type of financial advice. I enjoy charting and discussing technical analysis . Don't trade based on my advice. Do your own research! #cryptopickk
Ethereum price has been rising since the July lows. The chart shows a variety of signals with potential for upward movement around the resistance areas at the top of the Keltner Channel (KC) near the 0.382 Fibonacci level. A major concern is Volume dropping off.
Also Included: Fibonacci Retracement, RSI, MACD, Stochastic RSI, Ichimoku Cloud, and VPVR.
If you enjoy my ideas, feel free to like it and drop in a comment. I love reading your comments below.
Disclosure: This is just my opinion and not any type of financial advice. I enjoy charting and discussing technical analysis . Don't trade based on my advice. Do your own research! #cryptopickk

免责声明
这些信息和出版物并非旨在提供,也不构成TradingView提供或认可的任何形式的财务、投资、交易或其他类型的建议或推荐。请阅读使用条款了解更多信息。