
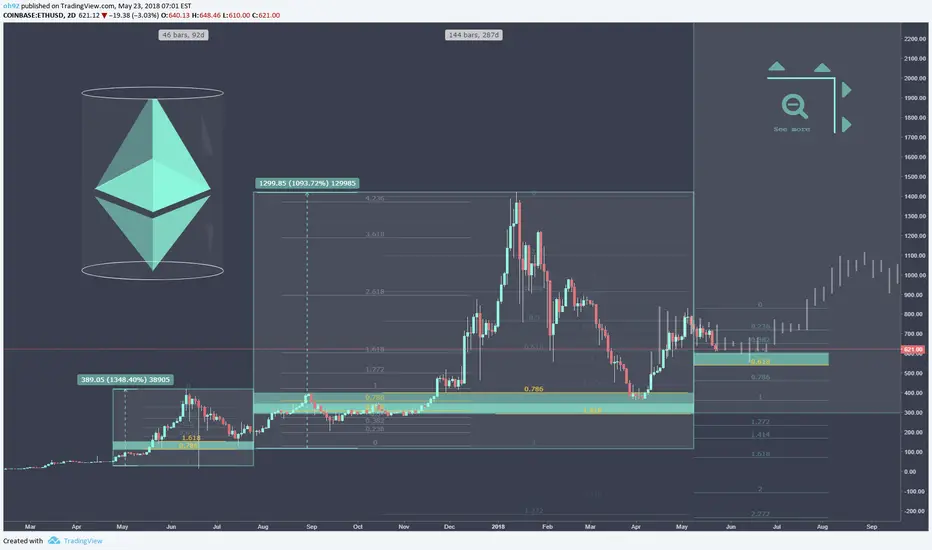
As the historical data has proven accurate over the last 2 months, ETH has now found itself in another correction.
If you have been following my previous historical data chart, where I perfectly called the bottom on Ethereum, this should come to no surprise.
As historical data shows that after the first bounce from the bottom, Ethereum will then return back to the .618 retracement zone.
This puts the potential bounce zone around $550.
IF this zone fails and Ethereum goes on to make a lower low. The second part of this experiment has failed. Regardless, thanks to this data we were able to perfectly call the last bottom, which proves historical data is the key to future predictions.
I hope you have all found this experiment interesting and profitable.
Wish you all the best of luck!
Link to original data experiment:
DISCLAIMER:
Please note I am only providing my own trading information for your benefit and insight to my trading techniques, you should do your own due diligence and not take this information as a trade signal.
If you have been following my previous historical data chart, where I perfectly called the bottom on Ethereum, this should come to no surprise.
As historical data shows that after the first bounce from the bottom, Ethereum will then return back to the .618 retracement zone.
This puts the potential bounce zone around $550.
IF this zone fails and Ethereum goes on to make a lower low. The second part of this experiment has failed. Regardless, thanks to this data we were able to perfectly call the last bottom, which proves historical data is the key to future predictions.
I hope you have all found this experiment interesting and profitable.
Wish you all the best of luck!
Link to original data experiment:
DISCLAIMER:
Please note I am only providing my own trading information for your benefit and insight to my trading techniques, you should do your own due diligence and not take this information as a trade signal.

Creator of DepthHouse Indicators on TradingView!
↣ depthhouse.com/
↣ depthhouse.com/
相关出版物
免责声明
这些信息和出版物并非旨在提供,也不构成TradingView提供或认可的任何形式的财务、投资、交易或其他类型的建议或推荐。请阅读使用条款了解更多信息。
Creator of DepthHouse Indicators on TradingView!
↣ depthhouse.com/
↣ depthhouse.com/
相关出版物
免责声明
这些信息和出版物并非旨在提供,也不构成TradingView提供或认可的任何形式的财务、投资、交易或其他类型的建议或推荐。请阅读使用条款了解更多信息。