
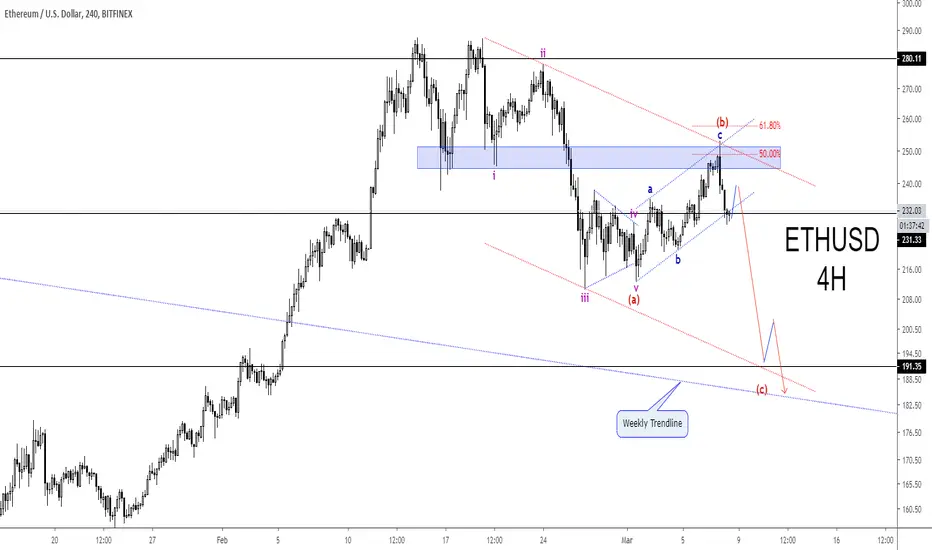
Ethereum sell-off from February high can be seen as a five-wave impulse pattern, labeled i-ii-iii-iv-v.
According to Elliot Wave rules, a three-wave correction follows every impulse wave. In ETHUSD's case, the rally from wave (a) low to wave (b) high unfolded as a three-wave a-b-c zigzag pattern.
The correction also terminated at a resistance zone that lined up with a descending trendline and 50% Fib. Once the correction is completed, the primary trend is resumes.
If this count is correct, a five-wave decline is expected in wave (c) to complete the simple zigzag pattern.
I will be looking for a retest of the channel support and weekly trendline for the target.
What's your view on ETHUSD?

免责声明
这些信息和出版物并非旨在提供,也不构成TradingView提供或认可的任何形式的财务、投资、交易或其他类型的建议或推荐。请阅读使用条款了解更多信息。