
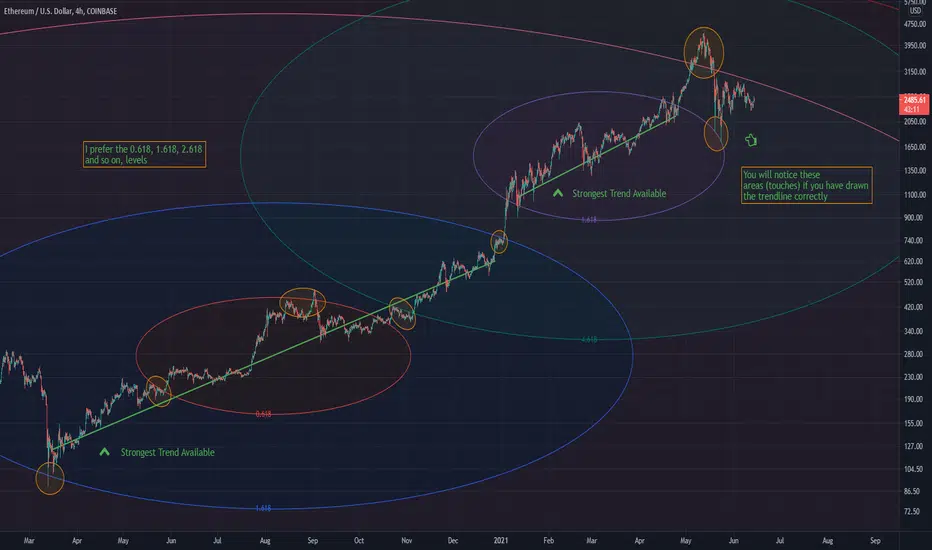
A guide for Fib circles
1 - Draw the trendline
2 - look for areas of confluence around the circle at levels for example 0.618, 1.618, 2.618, 3.618 ...
3 - Make an assessment
This is the 4Hour chart for Ethereum and isn't as reliable as using a higher timeframe, say drawing the trendlines through the entire bear market on the weekly for Ethereum would be more effective. Regardless it still serves its purpose.
This is little data for the current bull run.
This trendline drawing can be applied to any (weekly preferable) chart and assessments can be made based on the position of the price, above or below a key Fib level E.g (0.618)
Hope this helps aspiring chartists

1 - Draw the trendline
2 - look for areas of confluence around the circle at levels for example 0.618, 1.618, 2.618, 3.618 ...
3 - Make an assessment
This is the 4Hour chart for Ethereum and isn't as reliable as using a higher timeframe, say drawing the trendlines through the entire bear market on the weekly for Ethereum would be more effective. Regardless it still serves its purpose.
This is little data for the current bull run.
This trendline drawing can be applied to any (weekly preferable) chart and assessments can be made based on the position of the price, above or below a key Fib level E.g (0.618)
Hope this helps aspiring chartists

免责声明
这些信息和出版物并非旨在提供,也不构成TradingView提供或认可的任何形式的财务、投资、交易或其他类型的建议或推荐。请阅读使用条款了解更多信息。