
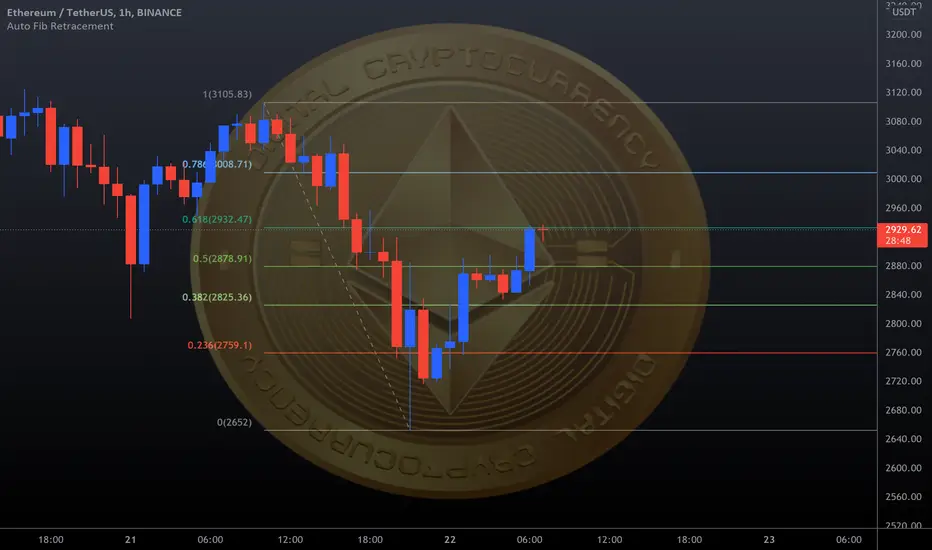
$ 3,000 Ethereum support collapses; In this case, there is a greater risk of falling unless the $ 3,000 resistance is re-conquered.
#ETH experienced another drop this time from the $ 3,100 resistance. As a result, many important support levels were lost and prices moved away from the moving average.
Meanwhile, support at $ 2,800 collapsed and the bearish atmosphere intensified. Finally, the price correction began with the $ 2,651 price floor. So far, Ethereum has crossed the $ 2,800 and $ 2,850 resistance levels.
The 23.6% Fibonacci retracement level of the fall is reversed from the $ 3,105 price ceiling to the $ 2,651 floor. The nearest resistance level upstream is around $ 2,880. The ETH/USD's hourly chart also shows a significant downtrend with resistance around $ 3,000.
The Fibonacci level of 50% has doubled its importance with its proximity to this range. Climbing and closing Kendall above the $ 3,000 resistance will probably be the beginning of a steady uptrend. The next significant resistance is likely to be in the $ 3,105 range. Above that is the $ 3,135 range and the moving average of key resistance.
If the Ethereum is unable to climb above the $ 3,000 resistance, there is a possibility of further collapse. The nearest downstream support level is around $ 2,800.
It seems to have formed a strong support base around $ 2,650. With its collapse, prices are likely to fall to $ 2,550 and $ 2,500. After that, the next support is $2,420 range.
#ETH experienced another drop this time from the $ 3,100 resistance. As a result, many important support levels were lost and prices moved away from the moving average.
Meanwhile, support at $ 2,800 collapsed and the bearish atmosphere intensified. Finally, the price correction began with the $ 2,651 price floor. So far, Ethereum has crossed the $ 2,800 and $ 2,850 resistance levels.
The 23.6% Fibonacci retracement level of the fall is reversed from the $ 3,105 price ceiling to the $ 2,651 floor. The nearest resistance level upstream is around $ 2,880. The ETH/USD's hourly chart also shows a significant downtrend with resistance around $ 3,000.
The Fibonacci level of 50% has doubled its importance with its proximity to this range. Climbing and closing Kendall above the $ 3,000 resistance will probably be the beginning of a steady uptrend. The next significant resistance is likely to be in the $ 3,105 range. Above that is the $ 3,135 range and the moving average of key resistance.
If the Ethereum is unable to climb above the $ 3,000 resistance, there is a possibility of further collapse. The nearest downstream support level is around $ 2,800.
It seems to have formed a strong support base around $ 2,650. With its collapse, prices are likely to fall to $ 2,550 and $ 2,500. After that, the next support is $2,420 range.

Join the free Telegram channel
💎 Telegram Channel: t.me/MonoCoin_Public
🔔 Bot: t.me/MonoCoinSignal_Bot?start=starter_tv
🌐 Website: MonoCoin.net
⭐️ 5-Star TrustPilot: trustpilot.com/review/monocoin.net
💎 Telegram Channel: t.me/MonoCoin_Public
🔔 Bot: t.me/MonoCoinSignal_Bot?start=starter_tv
🌐 Website: MonoCoin.net
⭐️ 5-Star TrustPilot: trustpilot.com/review/monocoin.net
免责声明
这些信息和出版物并非旨在提供,也不构成TradingView提供或认可的任何形式的财务、投资、交易或其他类型的建议或推荐。请阅读使用条款了解更多信息。
Join the free Telegram channel
💎 Telegram Channel: t.me/MonoCoin_Public
🔔 Bot: t.me/MonoCoinSignal_Bot?start=starter_tv
🌐 Website: MonoCoin.net
⭐️ 5-Star TrustPilot: trustpilot.com/review/monocoin.net
💎 Telegram Channel: t.me/MonoCoin_Public
🔔 Bot: t.me/MonoCoinSignal_Bot?start=starter_tv
🌐 Website: MonoCoin.net
⭐️ 5-Star TrustPilot: trustpilot.com/review/monocoin.net
免责声明
这些信息和出版物并非旨在提供,也不构成TradingView提供或认可的任何形式的财务、投资、交易或其他类型的建议或推荐。请阅读使用条款了解更多信息。