
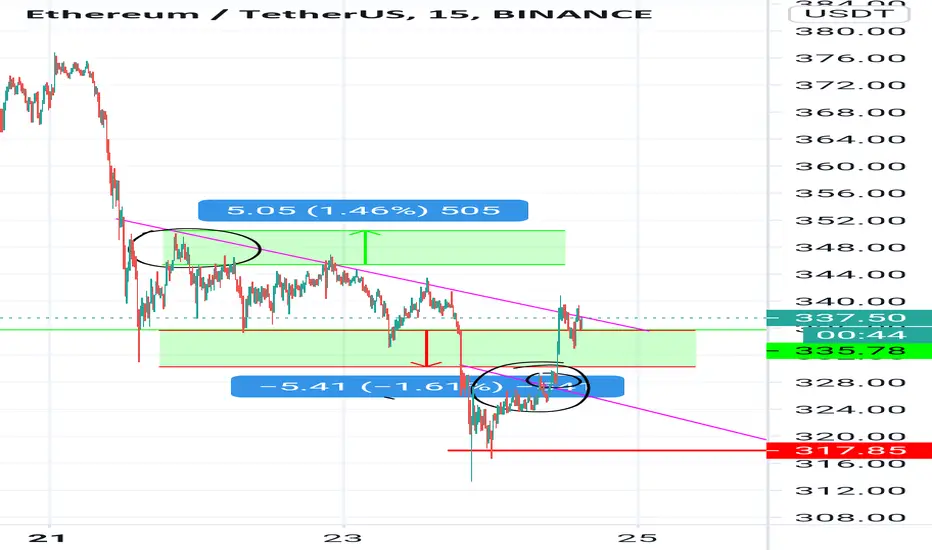
In the graph I have rounded two points..the curves look similar but difference between two moves are..the above curve retested the resistance level..but it took downward path..
The below curve why it exploded up? The reason is after retest near the resistance it consolidated near the resistance that's a indicator of a bullish move..the inner circle below circled one is the consolidated area
The below curve why it exploded up? The reason is after retest near the resistance it consolidated near the resistance that's a indicator of a bullish move..the inner circle below circled one is the consolidated area
交易结束:到达目标
If u guys watch the move in 5m time frame it would be a better clarity
免责声明
这些信息和出版物并非旨在提供,也不构成TradingView提供或认可的任何形式的财务、投资、交易或其他类型的建议或推荐。请阅读使用条款了解更多信息。
免责声明
这些信息和出版物并非旨在提供,也不构成TradingView提供或认可的任何形式的财务、投资、交易或其他类型的建议或推荐。请阅读使用条款了解更多信息。