
X Force Global Analysis:
If you find our analyses to be helpful, make sure to support us by dropping a ‘like’
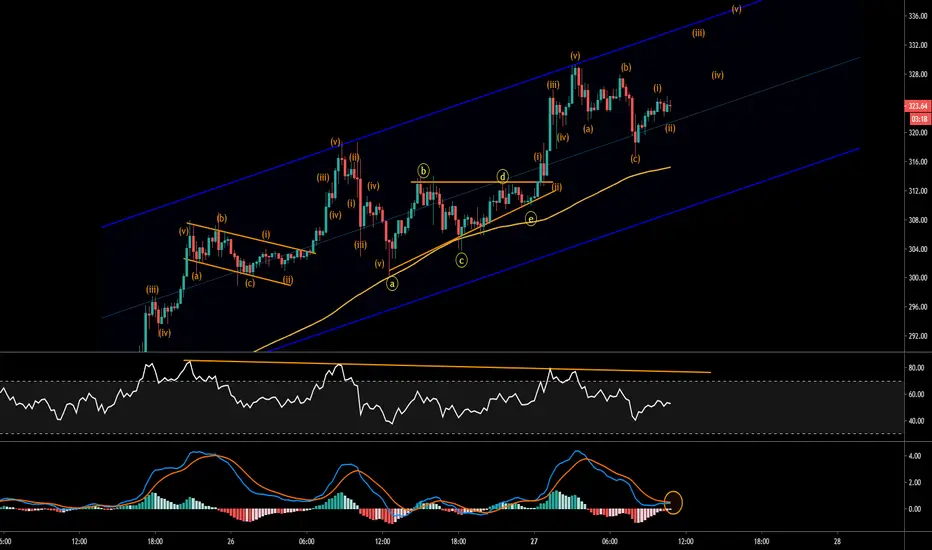
In this analysis, we look at Ethereum's 15 minute chart on its Tether (USDT) pair to assess its next potential move.
Analysis
- Firstly, we can see that Ethereum is trading within an ascending parallel channel, a sign of bullish momentum
- Unfortunately, however, prices are creating higher highs, while the Relative Strength Index (RSI) creates lower highs
- Based on our Elliott Wave count, after seeing a corrective wave in play (ABC), we are currently in the midst of an impulse wave count (12345)
- With the Moving Average Convergence Divergence (MACD), we could potentially expect a bullish move to play out to the channel resistance
- This would validate the current bearish divergence of prices forming higher highs while the RSI forms lower highs
- Ethereum has been trading above the 100 Simple Moving Average (SMA) for an extended period of time, and a break and close below this moving average could provide further confirmation of a trend change.
What We Believe
While Ethereum has had a nice rally, based on Elliott wave counts, we expect Ethereum to reach higher highs within the ascending parallel channel for the immediate term.
Let us know what you think in the comment section below
Trade Safe.
If you find our analyses to be helpful, make sure to support us by dropping a ‘like’
In this analysis, we look at Ethereum's 15 minute chart on its Tether (USDT) pair to assess its next potential move.
Analysis
- Firstly, we can see that Ethereum is trading within an ascending parallel channel, a sign of bullish momentum
- Unfortunately, however, prices are creating higher highs, while the Relative Strength Index (RSI) creates lower highs
- Based on our Elliott Wave count, after seeing a corrective wave in play (ABC), we are currently in the midst of an impulse wave count (12345)
- With the Moving Average Convergence Divergence (MACD), we could potentially expect a bullish move to play out to the channel resistance
- This would validate the current bearish divergence of prices forming higher highs while the RSI forms lower highs
- Ethereum has been trading above the 100 Simple Moving Average (SMA) for an extended period of time, and a break and close below this moving average could provide further confirmation of a trend change.
What We Believe
While Ethereum has had a nice rally, based on Elliott wave counts, we expect Ethereum to reach higher highs within the ascending parallel channel for the immediate term.
Let us know what you think in the comment section below
Trade Safe.

🌎 Telegram | t.me/xforceglobal
📢 Twitter | twitter.com/XForceGlobal
🎥 YouTube | youtube.com/c/XForceGlobal
📢 Twitter | twitter.com/XForceGlobal
🎥 YouTube | youtube.com/c/XForceGlobal
相关出版物
免责声明
这些信息和出版物并非旨在提供,也不构成TradingView提供或认可的任何形式的财务、投资、交易或其他类型的建议或推荐。请阅读使用条款了解更多信息。
🌎 Telegram | t.me/xforceglobal
📢 Twitter | twitter.com/XForceGlobal
🎥 YouTube | youtube.com/c/XForceGlobal
📢 Twitter | twitter.com/XForceGlobal
🎥 YouTube | youtube.com/c/XForceGlobal
相关出版物
免责声明
这些信息和出版物并非旨在提供,也不构成TradingView提供或认可的任何形式的财务、投资、交易或其他类型的建议或推荐。请阅读使用条款了解更多信息。