Hello, traders!
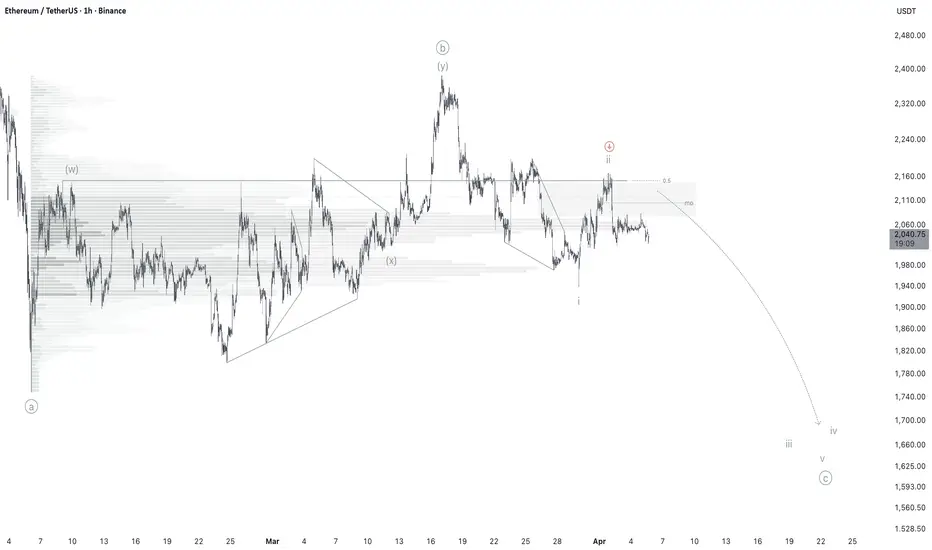
Two months of sideways action have created an illusion of calm, but beneath this consolidation the market is preparing for a serious move. Oscillators have reset, the “altseason believers” are back whispering about a miracle again. But the chart is telling a very different story —
 ETHUSDT ETHUSD ETH1! is preparing for a move down, and here’s why.
MAIN SCENARIO: THE DROP IS ALREADY IN MOTION

The picture here is crystal clear — weakness across all levels:
✗ Price is below the critical 2150 level — and that’s not random
✗ Trading below the monthly open — a clear bearish signal
✗ Bearish reactions from nearby daily imbalances show that buyers are unable to hold control

The mid-term chart (12h) confirms the concern. Around 2400, price tested the 1σ VWAP and got a clean rejection from a weekly imbalance. All conditions for continuation to the downside are already in place — the only thing left is the trigger.
Proof — stablecoins

Take a look at USDT dominance — it’s showing a striking fractal resemblance to the 2022 bear cycle. If history repeats (and it often does), we may be at the beginning of a larger downside move across the crypto market.

USDC dominance confirms it as well — on lower timeframes we can clearly see a running triangle as part of a sideways correction. That’s typically a continuation structure, suggesting capital is rotating into safety rather than risk.
As a result — the probability of further downside is EXTREMELY HIGH.
ALTERNATIVE SCENARIO: “WHAT IF?”

You always need a Plan B, because anything can happen in this market.
If the downside does not play out in the coming days and price starts showing signs of continued consolidation, we can consider another scenario: a move back toward 2150, possibly even a breakout above it. That would open the door for one more push higher — and only then continuation to the downside.
I’ve illustrated this scenario on the chart. But: this is a contingency plan, not the base case.
Two months of sideways action have created an illusion of calm, but beneath this consolidation the market is preparing for a serious move. Oscillators have reset, the “altseason believers” are back whispering about a miracle again. But the chart is telling a very different story —
ETHUSDT ETHUSD ETH1! is preparing for a move down, and here’s why.MAIN SCENARIO: THE DROP IS ALREADY IN MOTION
The picture here is crystal clear — weakness across all levels:
✗ Price is below the critical 2150 level — and that’s not random
✗ Trading below the monthly open — a clear bearish signal
✗ Bearish reactions from nearby daily imbalances show that buyers are unable to hold control
The mid-term chart (12h) confirms the concern. Around 2400, price tested the 1σ VWAP and got a clean rejection from a weekly imbalance. All conditions for continuation to the downside are already in place — the only thing left is the trigger.
Proof — stablecoins
Take a look at USDT dominance — it’s showing a striking fractal resemblance to the 2022 bear cycle. If history repeats (and it often does), we may be at the beginning of a larger downside move across the crypto market.
USDC dominance confirms it as well — on lower timeframes we can clearly see a running triangle as part of a sideways correction. That’s typically a continuation structure, suggesting capital is rotating into safety rather than risk.
As a result — the probability of further downside is EXTREMELY HIGH.
ALTERNATIVE SCENARIO: “WHAT IF?”
You always need a Plan B, because anything can happen in this market.
If the downside does not play out in the coming days and price starts showing signs of continued consolidation, we can consider another scenario: a move back toward 2150, possibly even a breakout above it. That would open the door for one more push higher — and only then continuation to the downside.
I’ve illustrated this scenario on the chart. But: this is a contingency plan, not the base case.

免责声明
这些信息和出版物并非旨在提供,也不构成TradingView提供或认可的任何形式的财务、投资、交易或其他类型的建议或推荐。请阅读使用条款了解更多信息。