
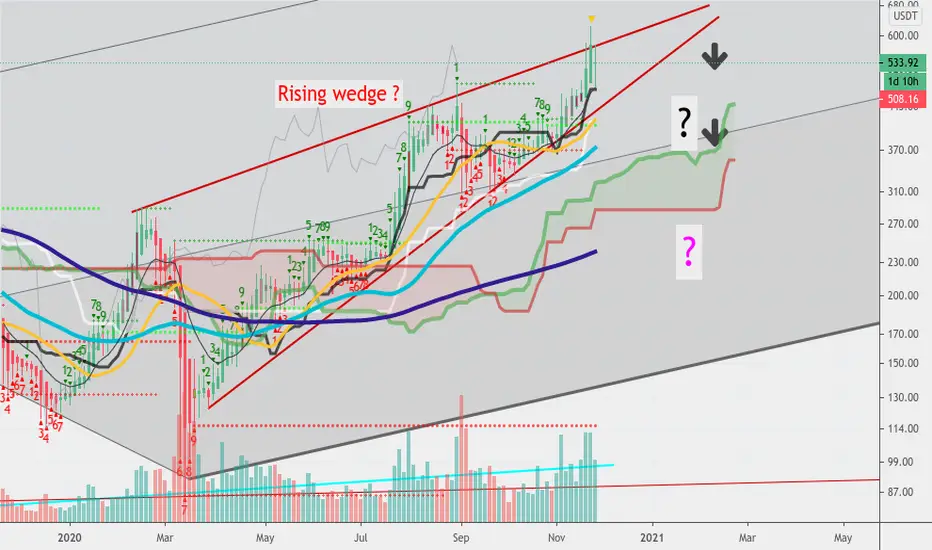
Here we see our ETH tether chart from Binance . It appears there is a large Rising wedge pattern on this chart ( in those red lines ) from the dumpout in March . This pattern forming in an uptrend should eventually trigger a correction and break downward out of this pattern . First target downward could be the top of our Ichimoku cloud around 380 to 420 or thereabouts but this correction could continue downward - it's hard to say what is bottom right now. But correction DOES eventually come to all patterns though I know some Perma Bull don't believe it ! Also see my last idea linked below about ETH reaching it's All time high again - which I still believe is coming . But perhaps we see correction first before we get there. Let's see.
Also please search for info on Rising Wedge pattern today - there are many trading sites with free info on this pattern and its' possibilities .
Thank you !
Also please search for info on Rising Wedge pattern today - there are many trading sites with free info on this pattern and its' possibilities .
Thank you !

😃 Join shimmeringpath's friendly free
Telegram chat here : bulls and bears both welcome !
t.me/CryptoRisingTradersChat
Telegram chat here : bulls and bears both welcome !
t.me/CryptoRisingTradersChat
相关出版物
免责声明
这些信息和出版物并非旨在提供,也不构成TradingView提供或认可的任何形式的财务、投资、交易或其他类型的建议或推荐。请阅读使用条款了解更多信息。
😃 Join shimmeringpath's friendly free
Telegram chat here : bulls and bears both welcome !
t.me/CryptoRisingTradersChat
Telegram chat here : bulls and bears both welcome !
t.me/CryptoRisingTradersChat
相关出版物
免责声明
这些信息和出版物并非旨在提供,也不构成TradingView提供或认可的任何形式的财务、投资、交易或其他类型的建议或推荐。请阅读使用条款了解更多信息。