
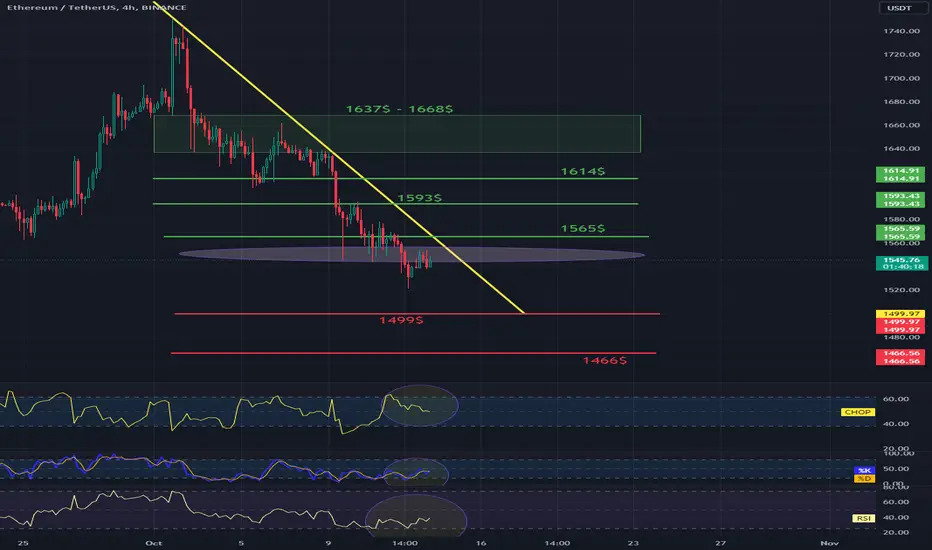
Hello everyone, let's take a look at the ETH to USDT chart on a 4-hour time frame. As you can see, the price is moving just below the local downtrend line.
After unfolding the Trend Based Fib Extension grid, we see that the price remains under support, while the next support is at $1,499, and further at $1,466.
Looking the other way, the first resistance is at $1,565, then we have resistance at $1,593, the next resistance at $1,614, and then we have the resistance zone from $1,637 to $1,668.
Looking at the CHOP indicator, we see that there is still energy for movement, on the STOCH indicator we have a slight rebound with room for growth, while the RSI indicator is moving towards the lower limit and we are currently experiencing a slight increase.
After unfolding the Trend Based Fib Extension grid, we see that the price remains under support, while the next support is at $1,499, and further at $1,466.
Looking the other way, the first resistance is at $1,565, then we have resistance at $1,593, the next resistance at $1,614, and then we have the resistance zone from $1,637 to $1,668.
Looking at the CHOP indicator, we see that there is still energy for movement, on the STOCH indicator we have a slight rebound with room for growth, while the RSI indicator is moving towards the lower limit and we are currently experiencing a slight increase.

免责声明
这些信息和出版物并非旨在提供,也不构成TradingView提供或认可的任何形式的财务、投资、交易或其他类型的建议或推荐。请阅读使用条款了解更多信息。
免责声明
这些信息和出版物并非旨在提供,也不构成TradingView提供或认可的任何形式的财务、投资、交易或其他类型的建议或推荐。请阅读使用条款了解更多信息。