
Now, it’s worth taking a look at higher timeframes.
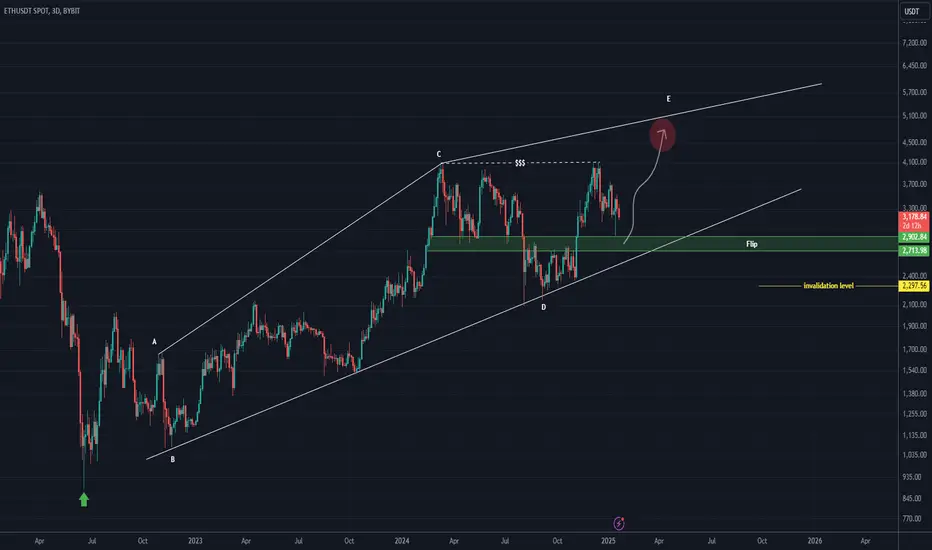
Regarding Ethereum's bearish scenario, as you may recall, we previously considered a large triangle for Ethereum, which remains valid and has not been invalidated.
However, the available data suggests that the scenario from this analysis is still valid as well. The strength of the bounce from the green zone to the upside will determine the next scenario, indicating that we need more data.
The market in higher timeframes, like the 3-day chart, is corrective. This is why traders in the 4-hour timeframe are facing a bearish trend. Support from Trump and the U.S. government for Bitcoin has also slowed down this correction, extending its duration.
In any case, the green zone could reverse the trend in the 3-day timeframe toward the red circle.
For risk management, please don't forget stop loss and capital management
Comment if you have any questions
Thank You
Regarding Ethereum's bearish scenario, as you may recall, we previously considered a large triangle for Ethereum, which remains valid and has not been invalidated.
However, the available data suggests that the scenario from this analysis is still valid as well. The strength of the bounce from the green zone to the upside will determine the next scenario, indicating that we need more data.
The market in higher timeframes, like the 3-day chart, is corrective. This is why traders in the 4-hour timeframe are facing a bearish trend. Support from Trump and the U.S. government for Bitcoin has also slowed down this correction, extending its duration.
In any case, the green zone could reverse the trend in the 3-day timeframe toward the red circle.
For risk management, please don't forget stop loss and capital management
Comment if you have any questions
Thank You

✅ Join our Telegram channel to succeed in crypto trading.
💎Our CRYPTO Telegram Channel: 👉 t.me/Behdark_EN
💎Our FOREX Telegram Channel: 👉 t.me/FX_Behdark
💎Our CRYPTO Telegram Channel: 👉 t.me/Behdark_EN
💎Our FOREX Telegram Channel: 👉 t.me/FX_Behdark
免责声明
这些信息和出版物并非旨在提供,也不构成TradingView提供或认可的任何形式的财务、投资、交易或其他类型的建议或推荐。请阅读使用条款了解更多信息。
✅ Join our Telegram channel to succeed in crypto trading.
💎Our CRYPTO Telegram Channel: 👉 t.me/Behdark_EN
💎Our FOREX Telegram Channel: 👉 t.me/FX_Behdark
💎Our CRYPTO Telegram Channel: 👉 t.me/Behdark_EN
💎Our FOREX Telegram Channel: 👉 t.me/FX_Behdark
免责声明
这些信息和出版物并非旨在提供,也不构成TradingView提供或认可的任何形式的财务、投资、交易或其他类型的建议或推荐。请阅读使用条款了解更多信息。