
Hello?
Traders, welcome.
If you "Follow", you can always get new information quickly.
Please also click "Boost".
Have a good day.
-------------------------------------
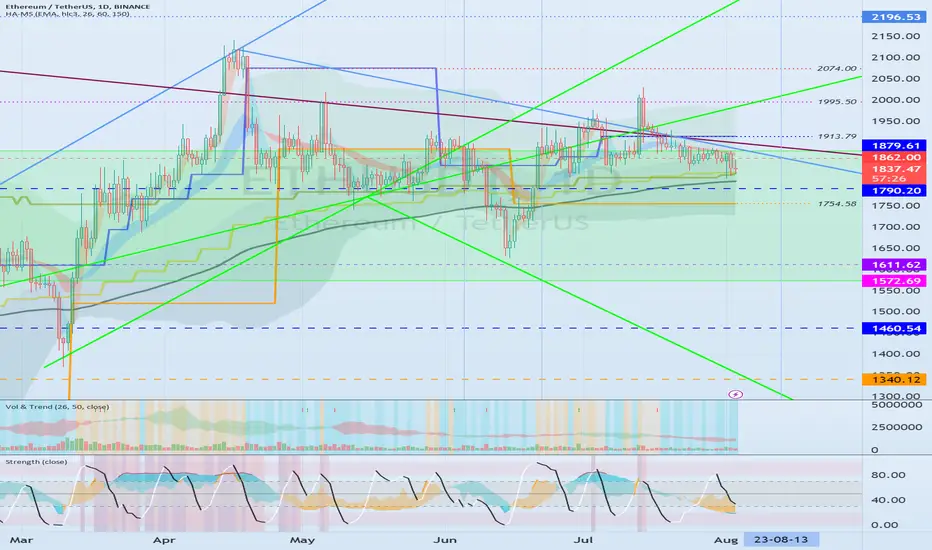
(ETHUSDT chart)

The trend has been changed by price volatility.
Accordingly, the next period of volatility is around August 13th.
The period of volatility that began around August 13th is likely to continue until around September 24th.
At this time, depending on whether ETH leads the coin market, the meaning of this volatility is expected to change.
What matters in this volatility period is whether it can break above the long-term downtrend line by moving higher above 1862.00.
Currently, ETH is showing signs of touching important indicators as it falls to the 1790.20-1862.0 zone.
Therefore, the important question is whether it can receive support and rise in the 1790.20-1862.0 section while passing through the volatility period around August 13th.
In the end, it is expected that the mid- to long-term trend will be determined by whether it is supported or resisted in the 1572.69-1879.61 section, which has been said to be an important support and resistance section.
-------------------------------------------------- -------------------------------------------
** All descriptions are for reference only and do not guarantee profit or loss in investment.
** Even if you know other people's know-how, it takes a considerable period of time to make it your own.
** This is a chart created with my know-how.
---------------------------------
Traders, welcome.
If you "Follow", you can always get new information quickly.
Please also click "Boost".
Have a good day.
-------------------------------------
(ETHUSDT chart)
The trend has been changed by price volatility.
Accordingly, the next period of volatility is around August 13th.
The period of volatility that began around August 13th is likely to continue until around September 24th.
At this time, depending on whether ETH leads the coin market, the meaning of this volatility is expected to change.
What matters in this volatility period is whether it can break above the long-term downtrend line by moving higher above 1862.00.
Currently, ETH is showing signs of touching important indicators as it falls to the 1790.20-1862.0 zone.
Therefore, the important question is whether it can receive support and rise in the 1790.20-1862.0 section while passing through the volatility period around August 13th.
In the end, it is expected that the mid- to long-term trend will be determined by whether it is supported or resisted in the 1572.69-1879.61 section, which has been said to be an important support and resistance section.
-------------------------------------------------- -------------------------------------------
** All descriptions are for reference only and do not guarantee profit or loss in investment.
** Even if you know other people's know-how, it takes a considerable period of time to make it your own.
** This is a chart created with my know-how.
---------------------------------

YouTube: youtube.com/@readcrypto9837
※ Follow X to check out the posts.
※ X를 팔로우하고 게시물을 확인하세요.
◆ t.me/readCryptoChannel
[HA-MS Indicator]
bit.ly/3YxHgvN
[OBV Indicator]
bit.ly/4dcyny3
※ Follow X to check out the posts.
※ X를 팔로우하고 게시물을 확인하세요.
◆ t.me/readCryptoChannel
[HA-MS Indicator]
bit.ly/3YxHgvN
[OBV Indicator]
bit.ly/4dcyny3
相关出版物
免责声明
这些信息和出版物并非旨在提供,也不构成TradingView提供或认可的任何形式的财务、投资、交易或其他类型的建议或推荐。请阅读使用条款了解更多信息。
YouTube: youtube.com/@readcrypto9837
※ Follow X to check out the posts.
※ X를 팔로우하고 게시물을 확인하세요.
◆ t.me/readCryptoChannel
[HA-MS Indicator]
bit.ly/3YxHgvN
[OBV Indicator]
bit.ly/4dcyny3
※ Follow X to check out the posts.
※ X를 팔로우하고 게시물을 확인하세요.
◆ t.me/readCryptoChannel
[HA-MS Indicator]
bit.ly/3YxHgvN
[OBV Indicator]
bit.ly/4dcyny3
相关出版物
免责声明
这些信息和出版物并非旨在提供,也不构成TradingView提供或认可的任何形式的财务、投资、交易或其他类型的建议或推荐。请阅读使用条款了解更多信息。