
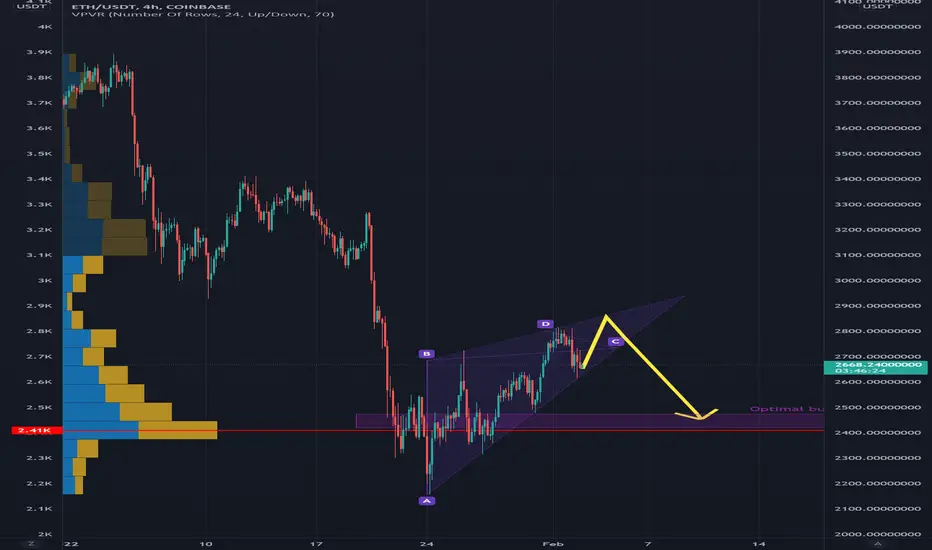
Rising wedge indicates a break down of eth price trend after local pump to 2850 range. Will likely follow with a massive pump upon hitting the buy zone,
注释
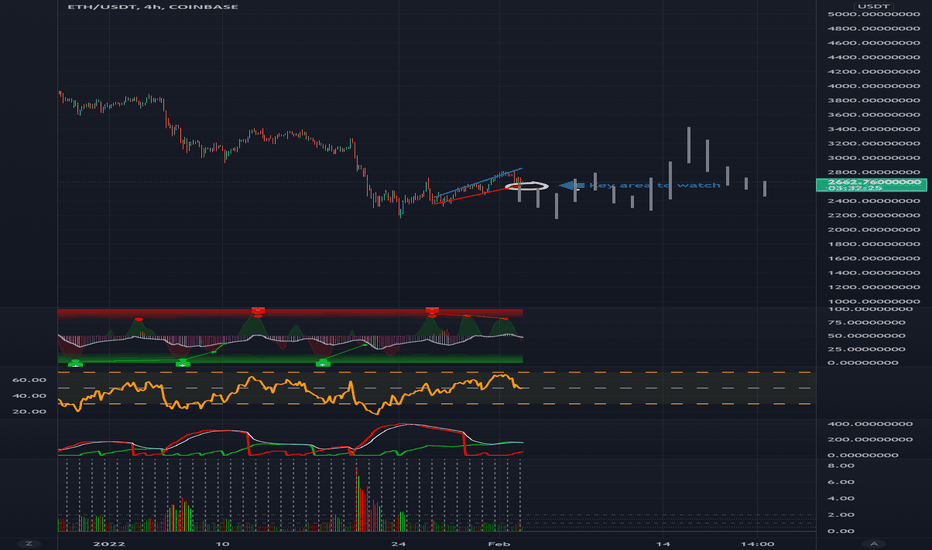
Also, if you look at the range from Jan. 26th to present on the 4hr chart, you will see an ascending broadening wedge pattern, indicating a potential break to the downside to occur. These two in combination may indicate that the break down may occur SOONER (next 24hrs-36hrs) rather than later as depicted by the wedge. If the candles retest the bottom support line of the broadening wedge 3 times on this current broadening wedge, expect a down turn to the optimal buyzone area. From here, expect a moon shot to $3000+ initially.注释

免责声明
这些信息和出版物并非旨在提供,也不构成TradingView提供或认可的任何形式的财务、投资、交易或其他类型的建议或推荐。请阅读使用条款了解更多信息。
免责声明
这些信息和出版物并非旨在提供,也不构成TradingView提供或认可的任何形式的财务、投资、交易或其他类型的建议或推荐。请阅读使用条款了解更多信息。