#ETH/USDT
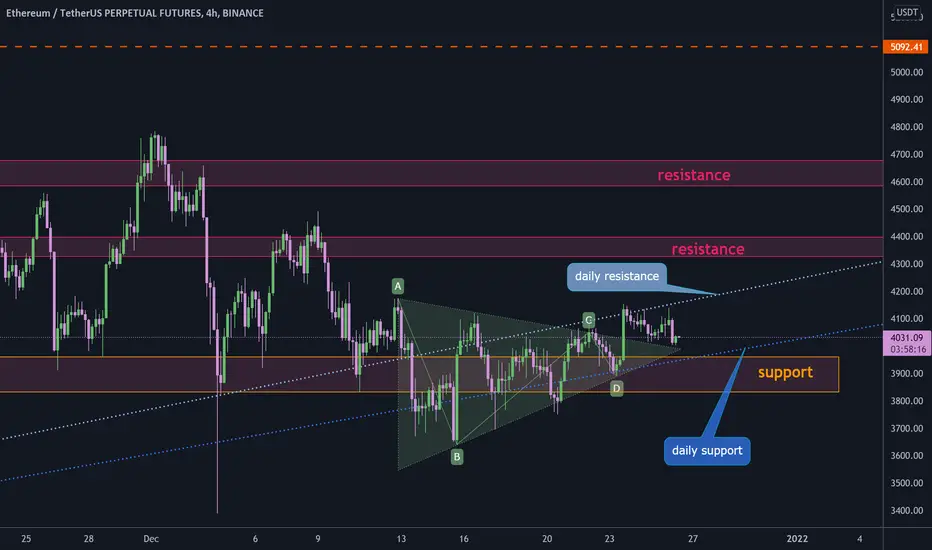
 ETH in daily chart is between to major ascending line that will show us the next move of #Ethereum. close a daily candle above daily ascending resistance will confirm the uptrend move and close a candle below daily ascending support will confirm down trend.
in 4h chart price broke out a triangle pattern and now pullback to this pattern. if price stay above triangle and head up to break out daily resistance it will increase toward $4350 and $4580 and maybe going to make a new ATH.
but if price drop below triangle and daily support zone we will see a long down trend to $3000.
ETH in daily chart is between to major ascending line that will show us the next move of #Ethereum. close a daily candle above daily ascending resistance will confirm the uptrend move and close a candle below daily ascending support will confirm down trend.in 4h chart price broke out a triangle pattern and now pullback to this pattern. if price stay above triangle and head up to break out daily resistance it will increase toward $4350 and $4580 and maybe going to make a new ATH.
but if price drop below triangle and daily support zone we will see a long down trend to $3000.

免责声明
这些信息和出版物并非旨在提供,也不构成TradingView提供或认可的任何形式的财务、投资、交易或其他类型的建议或推荐。请阅读使用条款了解更多信息。