

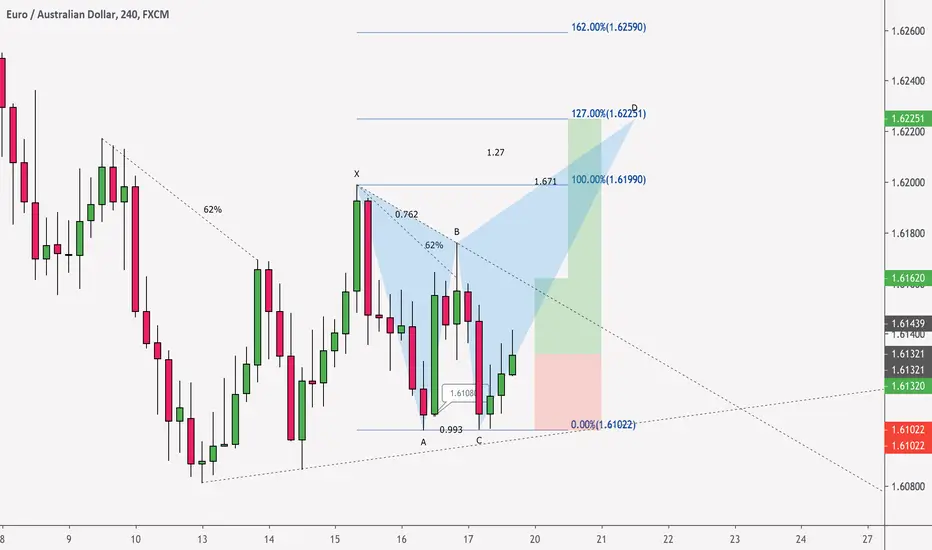
This chart appears to be forming a H&S pattern, but the bearish bias is not confirmed until the neckline has been breached. Until then I will be looking to long the Double Bottom pattern. Considering the 76% retracements there is high probability that price will rally up to complete the Butterfly.
Trendline break from ''XB'' indicates bullish momentum. A break above B confirms the butterfly. If any bullish wide range bars occurs from ''CD'' and/or at ''D'' it would be safe to target 162% XA.
Please leave a like and make sure you comment below with any idea regarding EUR/AUD
Thank you for reading
God bless and happy trading!
交易结束:到达目标

免责声明
这些信息和出版物并非旨在提供,也不构成TradingView提供或认可的任何形式的财务、投资、交易或其他类型的建议或推荐。请阅读使用条款了解更多信息。
免责声明
这些信息和出版物并非旨在提供,也不构成TradingView提供或认可的任何形式的财务、投资、交易或其他类型的建议或推荐。请阅读使用条款了解更多信息。