

D1 - Bearish convergence. As per the book scenario we may now expect a pullback to happen.
We may now look for evidences of bullish pressure on lower timeframes in order to trade this pullback.
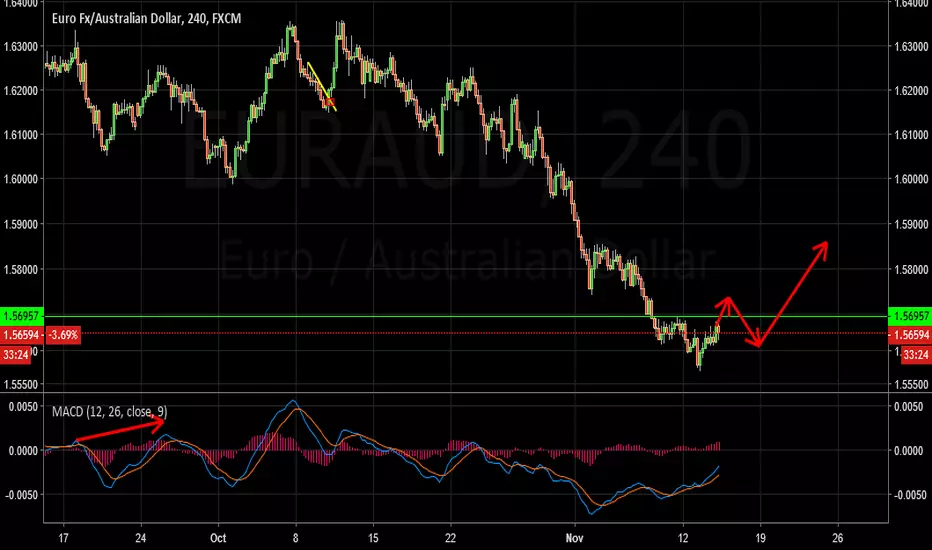
H4 - Two bullish divergences in a row.
If the price moves higher and breaks above the high (marked in green line), we may then look for pullbacks to happen with bullish hidden divergence to form (either on the H4 chart or on the H1 chart).
We may then look for buys with more bullish evidences. We may look for buys until we get any opposite signs.
We may now look for evidences of bullish pressure on lower timeframes in order to trade this pullback.
H4 - Two bullish divergences in a row.
If the price moves higher and breaks above the high (marked in green line), we may then look for pullbacks to happen with bullish hidden divergence to form (either on the H4 chart or on the H1 chart).
We may then look for buys with more bullish evidences. We may look for buys until we get any opposite signs.
注释
H4 - Price couldn't break the high we were looking for, instead it pushed lower for new low. Second possible divergence is now forming which gives the opportunity to look for aggressive buys upon completion of false break and the divergence.
免责声明
这些信息和出版物并非旨在提供,也不构成TradingView提供或认可的任何形式的财务、投资、交易或其他类型的建议或推荐。请阅读使用条款了解更多信息。
免责声明
这些信息和出版物并非旨在提供,也不构成TradingView提供或认可的任何形式的财务、投资、交易或其他类型的建议或推荐。请阅读使用条款了解更多信息。