

Hello traders,

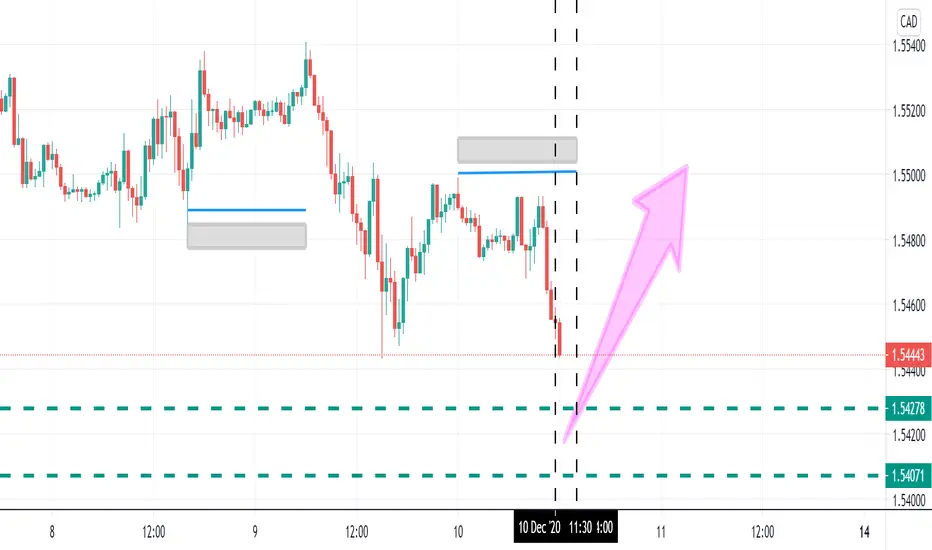
I believe there is a high probability of reversal based on the Time cycle zone (two vertical lines) in EUR/CAD.
This analysis is based on m30 timeframe but I defined the important price levels from H4 as you see in the chart above (dark background).
Time cycle zone shows best time to open position. It means the time period between two vertical lines is the best time to open position (here, buy position). But here, I prefer to wait more and get into the position as price reaches to the end of zone (second vertical line). It might also go upward before reaching to the second vertical line.
Make sure to Like and follow so you will receive notification of analysis update in a real time.
Good luck
P.S. Note that this analysis is my opinion and might be wrong. It is not a trading advice.
I believe there is a high probability of reversal based on the Time cycle zone (two vertical lines) in EUR/CAD.
This analysis is based on m30 timeframe but I defined the important price levels from H4 as you see in the chart above (dark background).
Time cycle zone shows best time to open position. It means the time period between two vertical lines is the best time to open position (here, buy position). But here, I prefer to wait more and get into the position as price reaches to the end of zone (second vertical line). It might also go upward before reaching to the second vertical line.
Make sure to Like and follow so you will receive notification of analysis update in a real time.
Good luck
P.S. Note that this analysis is my opinion and might be wrong. It is not a trading advice.
注释
for now, this time cycle zone has worked better in EUR/USD :) But I don't lose my faith, it will work in EUR/CAD too, just needs more patience ;)
let’s see what happens
交易结束:到达目标
It worked well and as I mentioned that drop in m30 became a false breakout so I'm out here, but it might continue upwards to the Pink horizontal line or more.
免责声明
这些信息和出版物并非旨在提供,也不构成TradingView提供或认可的任何形式的财务、投资、交易或其他类型的建议或推荐。请阅读使用条款了解更多信息。