

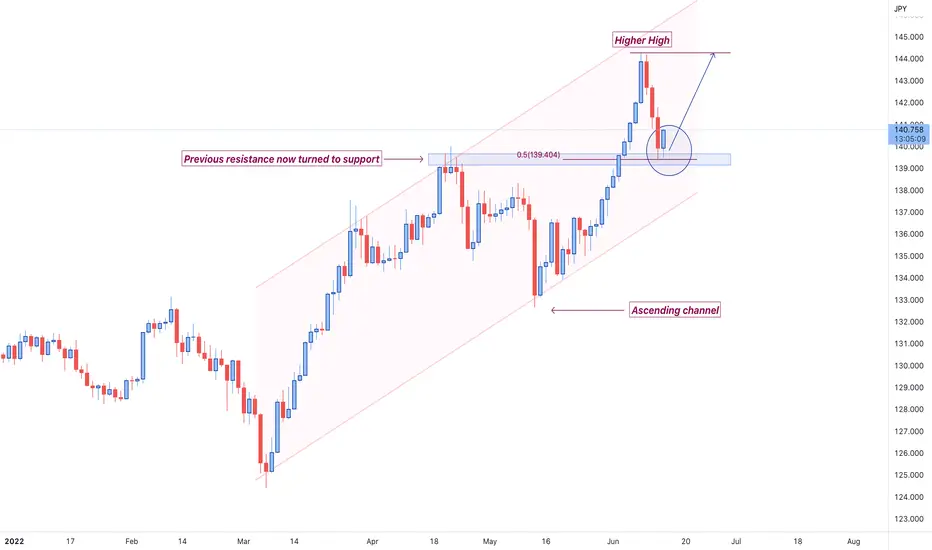
As it can be inferred from the graphical illustration, the price of EURJPY is trading within the borders of the ascending channel.
At the moment, the price is forming a bottom at the area of previous resistance later turned support that nicely lines up with 50% Fibonacci retracement level.
After receiving some confirmations on the lower timeframe charts, we will be looking at executing BUY positions and aiming for the area of the current Higher High plotted on the chart.
At the moment, the price is forming a bottom at the area of previous resistance later turned support that nicely lines up with 50% Fibonacci retracement level.
After receiving some confirmations on the lower timeframe charts, we will be looking at executing BUY positions and aiming for the area of the current Higher High plotted on the chart.

免责声明
这些信息和出版物并非旨在提供,也不构成TradingView提供或认可的任何形式的财务、投资、交易或其他类型的建议或推荐。请阅读使用条款了解更多信息。