

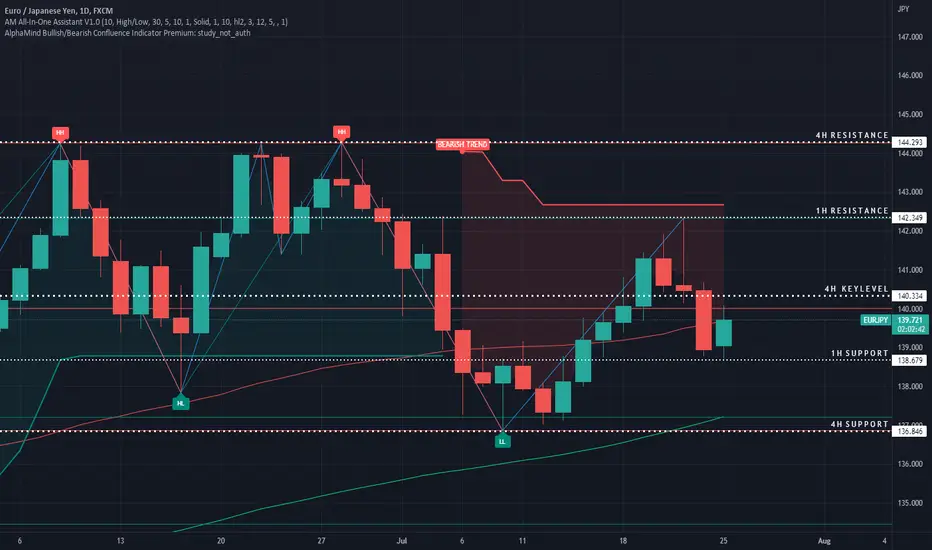
Identifying the Support (lowest price), Resistance (highest price), and Key Levels (areas price gravitates to between Support and Resistance) one two or more timeframes. Today, I have them marked on the 4H and 1H Timeframes.
Identifying Support
Support is the lowest level a price will go before reversing. A support is created in two ways. The first way is when Sellers in the market close their existing positions and take their profit. The second way is when new Buyers enter the market by opening new positions.
Identifying Resistance
Resistance is the highest level a price will go before reversing. A Resistance is created in two ways. The first way is when Buyers in the market close their existing positions and take their profit. The second way is when new Sellers are entering the market by opening new positions.
Chart Made Using AlphaMind AM All-In-One Indicator
Identifying Support
Support is the lowest level a price will go before reversing. A support is created in two ways. The first way is when Sellers in the market close their existing positions and take their profit. The second way is when new Buyers enter the market by opening new positions.
- Identify all historical Lows in a chart.
- Circle these zones.
- Connect as many as possible using straight horizontal lines. These are known as areas of Support.
Identifying Resistance
Resistance is the highest level a price will go before reversing. A Resistance is created in two ways. The first way is when Buyers in the market close their existing positions and take their profit. The second way is when new Sellers are entering the market by opening new positions.
- Identify all historical Highs in a chart.
- Circle these zones.
- Connect as many as possible using straight horizontal lines. These are known as areas of Resistance.
Chart Made Using AlphaMind AM All-In-One Indicator

免责声明
这些信息和出版物并非旨在提供,也不构成TradingView提供或认可的任何形式的财务、投资、交易或其他类型的建议或推荐。请阅读使用条款了解更多信息。
免责声明
这些信息和出版物并非旨在提供,也不构成TradingView提供或认可的任何形式的财务、投资、交易或其他类型的建议或推荐。请阅读使用条款了解更多信息。