

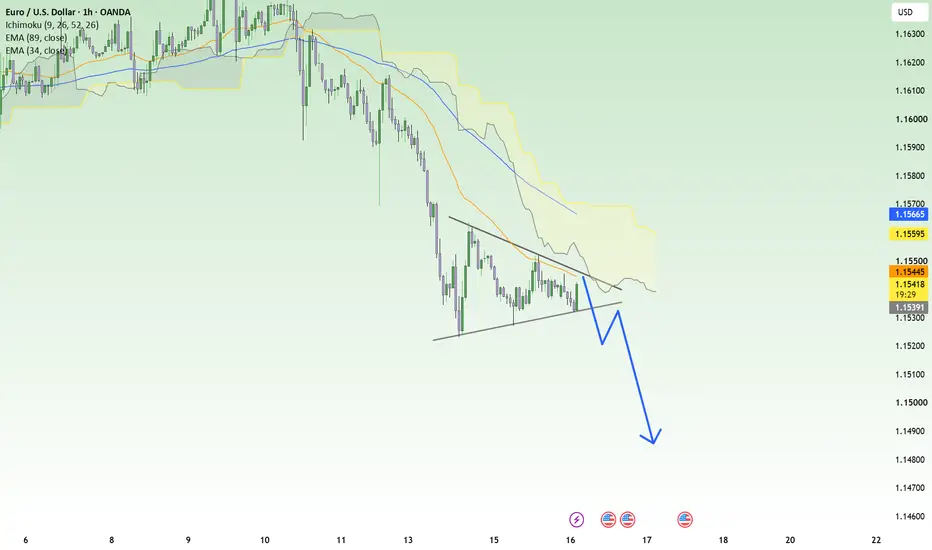
EURUSD is still trading with a clear bearish bias, supported by both the current macro environment and the technical structure on the H1 chart.
From a macro perspective, the U.S. dollar continues to have the advantage. Markets are pricing a high probability of a 25-basis-point Fed rate hike, while elevated U.S. Treasury yields continue to support the dollar. EURUSD has consequently remained under pressure ahead of the Fed decision. The ECB’s recent tightening provides some support for the euro, but in the short term, Fed expectations and U.S. yields remain the stronger drivers for this pair.
Technically, the picture is particularly interesting. Following the strong sell-off, EURUSD has formed what looks like a symmetrical triangle on the H1 timeframe, with price becoming increasingly compressed between descending resistance and rising support. Because this pattern is developing after a strong bearish move, I see it more as a potential continuation structure than an early signal of reversal. Price also remains below the Ichimoku Cloud, reinforcing the broader bearish trend.
The key now is the lower boundary of the triangle. If EURUSD produces a clean bearish breakout, the compression could release into another strong selling wave, with the 1.1490 area becoming the next downside target. Until price breaks above the triangle and successfully reclaims the Ichimoku resistance, I continue to favor SELL opportunities and expect the broader downtrend to remain in control.
From a macro perspective, the U.S. dollar continues to have the advantage. Markets are pricing a high probability of a 25-basis-point Fed rate hike, while elevated U.S. Treasury yields continue to support the dollar. EURUSD has consequently remained under pressure ahead of the Fed decision. The ECB’s recent tightening provides some support for the euro, but in the short term, Fed expectations and U.S. yields remain the stronger drivers for this pair.
Technically, the picture is particularly interesting. Following the strong sell-off, EURUSD has formed what looks like a symmetrical triangle on the H1 timeframe, with price becoming increasingly compressed between descending resistance and rising support. Because this pattern is developing after a strong bearish move, I see it more as a potential continuation structure than an early signal of reversal. Price also remains below the Ichimoku Cloud, reinforcing the broader bearish trend.
The key now is the lower boundary of the triangle. If EURUSD produces a clean bearish breakout, the compression could release into another strong selling wave, with the 1.1490 area becoming the next downside target. Until price breaks above the triangle and successfully reclaims the Ichimoku resistance, I continue to favor SELL opportunities and expect the broader downtrend to remain in control.
订单已取消

Want the full plan behind this analysis?
Free daily Forex, Gold, Crypto setups with reasoning
Entry, invalidation, targets and reviews
👉 Join free: t.me/+-HowPr1J4k03NGY1
Educational only. Not financial advice. Trading involves risk.
Free daily Forex, Gold, Crypto setups with reasoning
Entry, invalidation, targets and reviews
👉 Join free: t.me/+-HowPr1J4k03NGY1
Educational only. Not financial advice. Trading involves risk.
相关出版物
免责声明
这些信息和出版物并非旨在提供,也不构成TradingView提供或认可的任何形式的财务、投资、交易或其他类型的建议或推荐。请阅读使用条款了解更多信息。
Want the full plan behind this analysis?
Free daily Forex, Gold, Crypto setups with reasoning
Entry, invalidation, targets and reviews
👉 Join free: t.me/+-HowPr1J4k03NGY1
Educational only. Not financial advice. Trading involves risk.
Free daily Forex, Gold, Crypto setups with reasoning
Entry, invalidation, targets and reviews
👉 Join free: t.me/+-HowPr1J4k03NGY1
Educational only. Not financial advice. Trading involves risk.
相关出版物
免责声明
这些信息和出版物并非旨在提供,也不构成TradingView提供或认可的任何形式的财务、投资、交易或其他类型的建议或推荐。请阅读使用条款了解更多信息。