

EURO/USD
RSI SIGNAL ANALYSIS
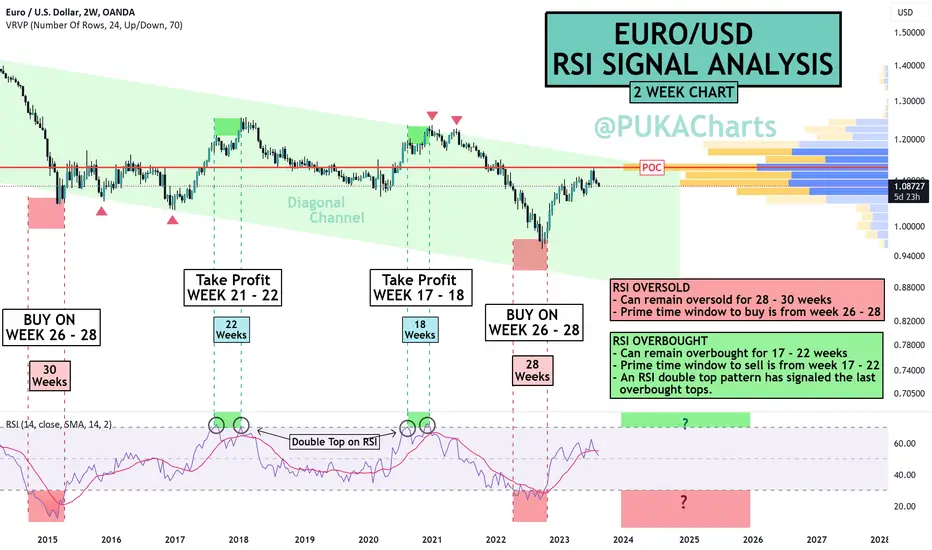
- Diagonal parallel channel acting as confinement zone
for price, good for timing buys/sells and for stops
above or below.
- Red zones on the chart are oversold levels and green
are overbought.
RSI OVERSOLD
- Can remain oversold for 28 - 30 weeks
- Prime time window to buy is from week 26 - 28
RSI OVERBOUGHT
- Can remain overbought for 17 - 22 weeks
- Prime time window to sell is from week 17 - 22
- An RSI double top pattern has signaled the last
overbought tops.
You can also clearly see the relevance of the POC Line which price oscillates around or has trouble with breaching.
We can observe what happens the next time the RSI is oversold or overbought and maybe we can use these weekly time windows to better gauge a buy or sell opportunity.
PUKA
RSI SIGNAL ANALYSIS
- Diagonal parallel channel acting as confinement zone
for price, good for timing buys/sells and for stops
above or below.
- Red zones on the chart are oversold levels and green
are overbought.
RSI OVERSOLD
- Can remain oversold for 28 - 30 weeks
- Prime time window to buy is from week 26 - 28
RSI OVERBOUGHT
- Can remain overbought for 17 - 22 weeks
- Prime time window to sell is from week 17 - 22
- An RSI double top pattern has signaled the last
overbought tops.
You can also clearly see the relevance of the POC Line which price oscillates around or has trouble with breaching.
We can observe what happens the next time the RSI is oversold or overbought and maybe we can use these weekly time windows to better gauge a buy or sell opportunity.
PUKA

免责声明
这些信息和出版物并非旨在提供,也不构成TradingView提供或认可的任何形式的财务、投资、交易或其他类型的建议或推荐。请阅读使用条款了解更多信息。
免责声明
这些信息和出版物并非旨在提供,也不构成TradingView提供或认可的任何形式的财务、投资、交易或其他类型的建议或推荐。请阅读使用条款了解更多信息。