

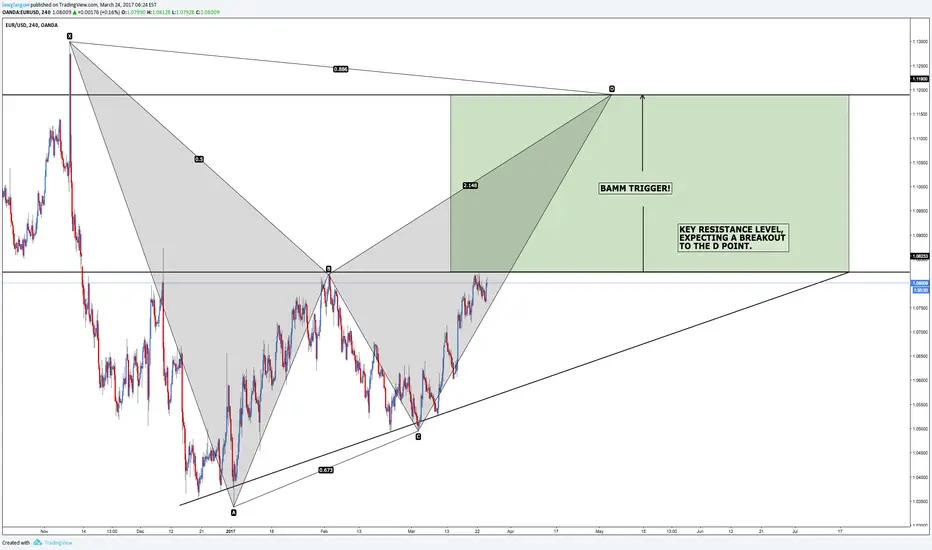
Wow this is huge! Today we have EUR/USD on the 4h chart with a bullish BAMM (Bat Action Magnet Move) setup .
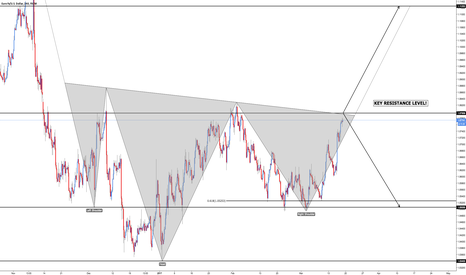
This is a follow up from my previous post (chart is shown below), where price formed a valid inverted head and shoulders pattern.
Today's setup further validates the move up, as we have a bearish bat currently completing the C to D move.
The measurements for a valid bat pattern are detailed below.
B: 0.382 - 0.50
C: 0.382 - 0.886
D: 1.618 - 2.618
Final X to D: 0.886
To add to this price is currently trading within an ascending triangle, this structure is holding really well.
Once I see a clear indication that price has broken and closed above the key resistance level (inverted head and shoulders neckline) I'll be going long.
Green area displays the profit zone.
I understand the BAMM theory will be relatively new to most traders, this style of trading simply focuses on a breakout of the B point.
Feel free to connect with me below :)
This is a follow up from my previous post (chart is shown below), where price formed a valid inverted head and shoulders pattern.
Today's setup further validates the move up, as we have a bearish bat currently completing the C to D move.
The measurements for a valid bat pattern are detailed below.
B: 0.382 - 0.50
C: 0.382 - 0.886
D: 1.618 - 2.618
Final X to D: 0.886
To add to this price is currently trading within an ascending triangle, this structure is holding really well.
Once I see a clear indication that price has broken and closed above the key resistance level (inverted head and shoulders neckline) I'll be going long.
Green area displays the profit zone.
I understand the BAMM theory will be relatively new to most traders, this style of trading simply focuses on a breakout of the B point.
Feel free to connect with me below :)
交易开始
Price has now closed above resistance, wait until we see a pullback before entering the move.Stop loss below support (previous resistance).
注释
This is the price structure I'm currently watching, as you can see we returned to support and closed below... There were no signs of stalling, it dropped 100 pips.I'll be watching this area closely for a move up, but price could potentially drop to the trendline before completing the bullish BAMM setup.
注释
We're now approaching D after a long 6 weeks, this is currently #1 on my watchlist at the moment.交易开始
Bearish bat is valid, stay safe everyone! A lot of high impact news over the next two weeks.注释
Here is what I see happening with EUR/USD on the 1h timeframe.Expecting further downside movement going into next week, pay close attention to minor support levels.

📈 Master the Art and Science of Trading: sixfigurecapital.com
相关出版物
免责声明
这些信息和出版物并非旨在提供,也不构成TradingView提供或认可的任何形式的财务、投资、交易或其他类型的建议或推荐。请阅读使用条款了解更多信息。
📈 Master the Art and Science of Trading: sixfigurecapital.com
相关出版物
免责声明
这些信息和出版物并非旨在提供,也不构成TradingView提供或认可的任何形式的财务、投资、交易或其他类型的建议或推荐。请阅读使用条款了解更多信息。