

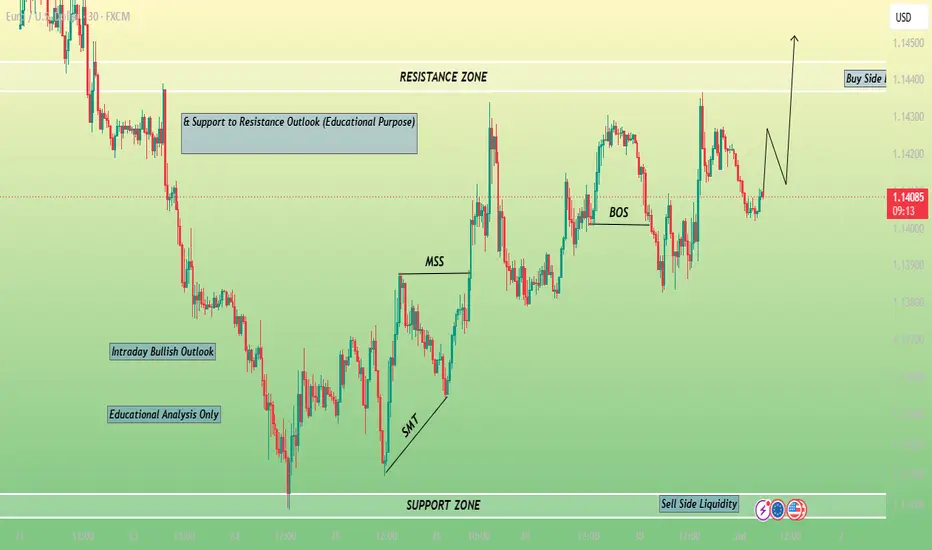
This chart presents an educational EUR/USD price action analysis based on Smart Money Concepts (SMC) and market structure. The highlighted Support Zone represents a key demand area where buyers may step in if price respects the level with strong bullish confirmation. The marked Market Structure Shift (MSS) indicates a potential change in market direction, while the Bullish Break of Structure (BOS) confirms that buyers have gained short-term control of the market.
The projected bullish path illustrates a possible continuation toward the Resistance Zone, provided the current support holds and bullish momentum remains strong. Traders should wait for confirmation through bullish candlestick patterns, market structure validation, and proper risk management before considering any trade entry. This chart is shared for educational purposes only and should not be interpreted as financial or investment advice. Always conduct your own analysis, follow a disciplined trading plan, and use appropriate risk management before entering the market.
The projected bullish path illustrates a possible continuation toward the Resistance Zone, provided the current support holds and bullish momentum remains strong. Traders should wait for confirmation through bullish candlestick patterns, market structure validation, and proper risk management before considering any trade entry. This chart is shared for educational purposes only and should not be interpreted as financial or investment advice. Always conduct your own analysis, follow a disciplined trading plan, and use appropriate risk management before entering the market.
交易开始
first target reached 
免责声明
这些信息和出版物并非旨在提供,也不构成TradingView提供或认可的任何形式的财务、投资、交易或其他类型的建议或推荐。请阅读使用条款了解更多信息。
免责声明
这些信息和出版物并非旨在提供,也不构成TradingView提供或认可的任何形式的财务、投资、交易或其他类型的建议或推荐。请阅读使用条款了解更多信息。