

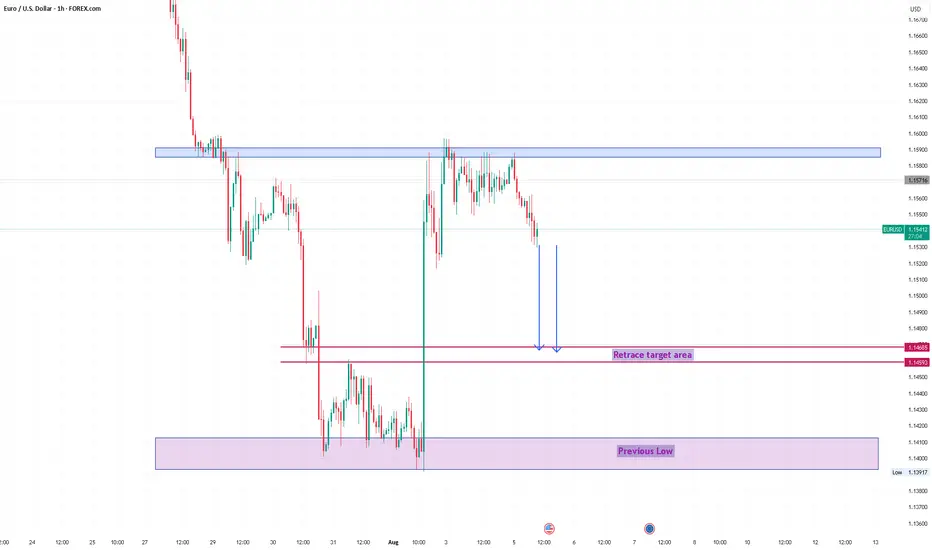
📉 Technical Breakdown:
1. Resistance Zone (Supply Zone) — 1.15700 to 1.15950
> Price was previously rejected strongly from this area, confirming it as a strong supply/resistance zone.
> Multiple rejections from this level indicate the presence of strong sellers.
2. Current Price Action:
> After retesting the resistance area, price is now dropping with momentum, forming strong bearish candles.
> The blue arrows show an expected continuation downward.
3. Retrace Target Area (Short-term Target) — 1.14685 to 1.14593
> This zone is likely the next support level or liquidity pool, where price might temporarily stall or bounce.
>It could be a profit-taking zone for intraday/swing sellers.
4. Previous Low / Major Support Zone — Around 1.14000 to 1.13917
> This purple box marks the previous significant low, which is a key bearish target.
> A break below this level would confirm a strong bearish trend continuation on a higher timeframe.
🧠 Trade Idea:
✅ Sell Setup in Play
Entry: Already in motion after rejection from the 1.15700–1.15950 zone
# TP1: 1.14685 (retracement target zone)
# TP2: 1.14000 area (previous low)
# SL Idea: Above 1.1600 (above resistance wick for safe margin)
✅ Conclusion:
> This chart shows a clear bearish market structure with room for downside.
> Expect continuation to 1.1468, then possibly to 1.1400, unless buyers step in around the retrace zone.
> Solid opportunity for trend-following short trades.
1. Resistance Zone (Supply Zone) — 1.15700 to 1.15950
> Price was previously rejected strongly from this area, confirming it as a strong supply/resistance zone.
> Multiple rejections from this level indicate the presence of strong sellers.
2. Current Price Action:
> After retesting the resistance area, price is now dropping with momentum, forming strong bearish candles.
> The blue arrows show an expected continuation downward.
3. Retrace Target Area (Short-term Target) — 1.14685 to 1.14593
> This zone is likely the next support level or liquidity pool, where price might temporarily stall or bounce.
>It could be a profit-taking zone for intraday/swing sellers.
4. Previous Low / Major Support Zone — Around 1.14000 to 1.13917
> This purple box marks the previous significant low, which is a key bearish target.
> A break below this level would confirm a strong bearish trend continuation on a higher timeframe.
🧠 Trade Idea:
✅ Sell Setup in Play
Entry: Already in motion after rejection from the 1.15700–1.15950 zone
# TP1: 1.14685 (retracement target zone)
# TP2: 1.14000 area (previous low)
# SL Idea: Above 1.1600 (above resistance wick for safe margin)
✅ Conclusion:
> This chart shows a clear bearish market structure with room for downside.
> Expect continuation to 1.1468, then possibly to 1.1400, unless buyers step in around the retrace zone.
> Solid opportunity for trend-following short trades.

免责声明
这些信息和出版物并非旨在提供,也不构成TradingView提供或认可的任何形式的财务、投资、交易或其他类型的建议或推荐。请阅读使用条款了解更多信息。
免责声明
这些信息和出版物并非旨在提供,也不构成TradingView提供或认可的任何形式的财务、投资、交易或其他类型的建议或推荐。请阅读使用条款了解更多信息。