

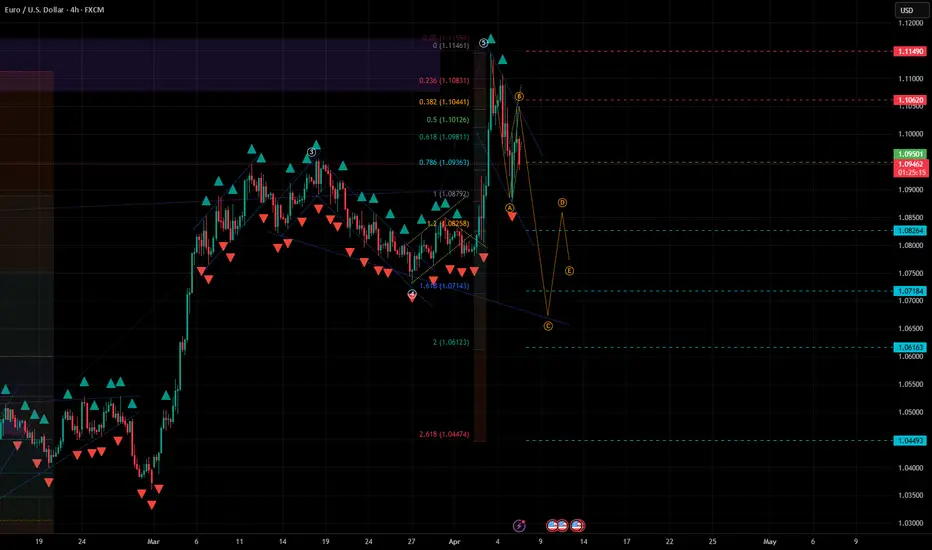
#EURUSD - UniverseMetta - Analysis
W1 (Weekly Timeframe)
🔹 Price has reached the 261 Fibonacci level, marking the completion of the 5th wave.
🔹 This level also aligns with a major structure established back in 2023.
🔹 To confirm potential short opportunities, it's recommended to:
• Wait for a confirmed fractal on W1
• Look for reversal patterns on lower timeframes (D1 / H4)
D1 (Daily Timeframe)
🔹 Possible development of a 1st wave within an expanding triangle structure.
🔹 All recent movements appear corrective until a valid 2nd wave begins to form.
🔹 Nearest downside targets:
• 1.08264
• 1.07184
H4 / H1 (4H / 1H Timeframes)
🔹 Potential start of wave C on H4
🔹 Triggered by the formation of the 3rd wave + breakout from the descending channel on H1
🔹 Trade setup details:
Entry: 1.09501
Take Profits (TP):
1. 1.08264
2. 1.07184
3. 1.06163
4. 1.04493
Stop Loss: 1.10620
📌Conclusion:
EURUSD has hit a major resistance zone (261% Fibo), which may mark the end of the bullish 5-wave structure. A correction or reversal could follow.
Lower timeframes offer early opportunities to enter wave C, with confirmation via fractals and breakouts.
Use tight stops and respect your risk management.
W1 (Weekly Timeframe)
🔹 Price has reached the 261 Fibonacci level, marking the completion of the 5th wave.
🔹 This level also aligns with a major structure established back in 2023.
🔹 To confirm potential short opportunities, it's recommended to:
• Wait for a confirmed fractal on W1
• Look for reversal patterns on lower timeframes (D1 / H4)
D1 (Daily Timeframe)
🔹 Possible development of a 1st wave within an expanding triangle structure.
🔹 All recent movements appear corrective until a valid 2nd wave begins to form.
🔹 Nearest downside targets:
• 1.08264
• 1.07184
H4 / H1 (4H / 1H Timeframes)
🔹 Potential start of wave C on H4
🔹 Triggered by the formation of the 3rd wave + breakout from the descending channel on H1
🔹 Trade setup details:
Entry: 1.09501
Take Profits (TP):
1. 1.08264
2. 1.07184
3. 1.06163
4. 1.04493
Stop Loss: 1.10620
📌Conclusion:
EURUSD has hit a major resistance zone (261% Fibo), which may mark the end of the bullish 5-wave structure. A correction or reversal could follow.
Lower timeframes offer early opportunities to enter wave C, with confirmation via fractals and breakouts.
Use tight stops and respect your risk management.

免责声明
这些信息和出版物并非旨在提供,也不构成TradingView提供或认可的任何形式的财务、投资、交易或其他类型的建议或推荐。请阅读使用条款了解更多信息。
免责声明
这些信息和出版物并非旨在提供,也不构成TradingView提供或认可的任何形式的财务、投资、交易或其他类型的建议或推荐。请阅读使用条款了解更多信息。