
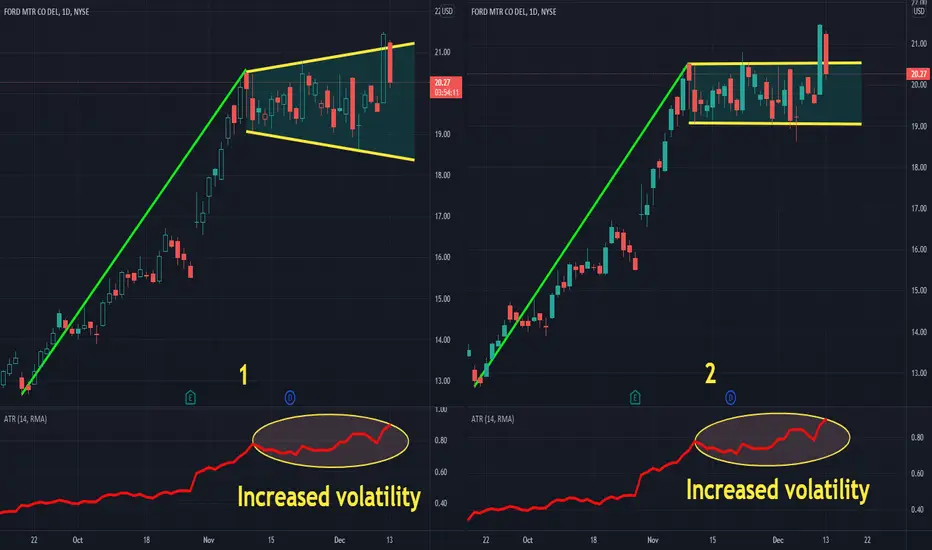
At the first glance, You may find both patterns correct and justify both!
But adding ATR to the chart may reveal the hidden truth!
ATR only measures volatility and not the direction of an asset's price.
Pattern 1: Broadening Formation or Megaphone
What Is a Broadening Formation?
A broadening formation is a price chart pattern identified by technical analysts. It is characterized by increasing price volatility and diagrammed as two diverging trend lines, one rising and one falling. It usually occurs after a significant rise, or fall, in the action of security prices. It is identified on a chart by a series of higher pivot highs and lower pivot lows.
Pattern 2: Corrction/consolidation
In this situation, we expect lower changes in ATR readings!
Best,
Moshkelgosha
DISCLAIMER
I’m not a certified financial planner/advisor, a certified financial analyst, an economist, a CPA, an accountant, or a lawyer. I’m not a finance professional through formal education. The contents on this site are for informational purposes only and do not constitute financial, accounting, or legal advice. I can’t promise that the information shared on my posts is appropriate for you or anyone else. By using this site, you agree to hold me harmless from any ramifications, financial or otherwise, that occur to you as a result of acting on information found on this site.
Reference Articles:
https://www.investopedia.com/terms/a/atr.asp
https://www.investopedia.com/terms/b/broadeningformation.asp
https://www.investopedia.com/terms/c/correction.asp
But adding ATR to the chart may reveal the hidden truth!
ATR only measures volatility and not the direction of an asset's price.
Pattern 1: Broadening Formation or Megaphone
What Is a Broadening Formation?
A broadening formation is a price chart pattern identified by technical analysts. It is characterized by increasing price volatility and diagrammed as two diverging trend lines, one rising and one falling. It usually occurs after a significant rise, or fall, in the action of security prices. It is identified on a chart by a series of higher pivot highs and lower pivot lows.
Pattern 2: Corrction/consolidation
In this situation, we expect lower changes in ATR readings!
Best,
Moshkelgosha
DISCLAIMER
I’m not a certified financial planner/advisor, a certified financial analyst, an economist, a CPA, an accountant, or a lawyer. I’m not a finance professional through formal education. The contents on this site are for informational purposes only and do not constitute financial, accounting, or legal advice. I can’t promise that the information shared on my posts is appropriate for you or anyone else. By using this site, you agree to hold me harmless from any ramifications, financial or otherwise, that occur to you as a result of acting on information found on this site.
Reference Articles:
https://www.investopedia.com/terms/a/atr.asp
https://www.investopedia.com/terms/b/broadeningformation.asp
https://www.investopedia.com/terms/c/correction.asp

Use the following link to access trading ideas: patreon.com/SniperTraderStocks?utm_medium=unknown&utm_source=join_link&utm_campaign=creatorshare_creator&utm_content=copyLink
免责声明
这些信息和出版物并非旨在提供,也不构成TradingView提供或认可的任何形式的财务、投资、交易或其他类型的建议或推荐。请阅读使用条款了解更多信息。
Use the following link to access trading ideas: patreon.com/SniperTraderStocks?utm_medium=unknown&utm_source=join_link&utm_campaign=creatorshare_creator&utm_content=copyLink
免责声明
这些信息和出版物并非旨在提供,也不构成TradingView提供或认可的任何形式的财务、投资、交易或其他类型的建议或推荐。请阅读使用条款了解更多信息。