
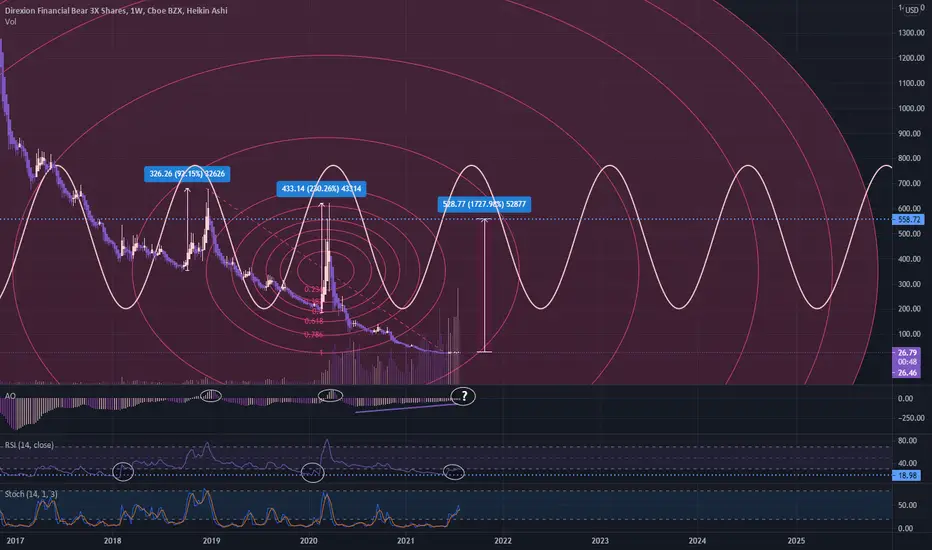
FAZ weekly chart presented and comparing last two price run ups to current condition.
AO appears to want to go positive. See chart for price reaction last two times this occurred on the weekly.
RSI bouncing off 18 month low with harmonics generally supporting a turn soon. Plenty of upward room for the stoch, but it does appear to be faltering a little here.
Note large volume buying of FAZ starting mid-June 2021 and a lot of overall interest in this derivative since just before the COVI-crash.
This volume isn't retail.
They say you cant' predict a black swan event but FAZ seems to be sensing something wicked.
Not financial advice.

免责声明
这些信息和出版物并非旨在提供,也不构成TradingView提供或认可的任何形式的财务、投资、交易或其他类型的建议或推荐。请阅读使用条款了解更多信息。