已更新
META
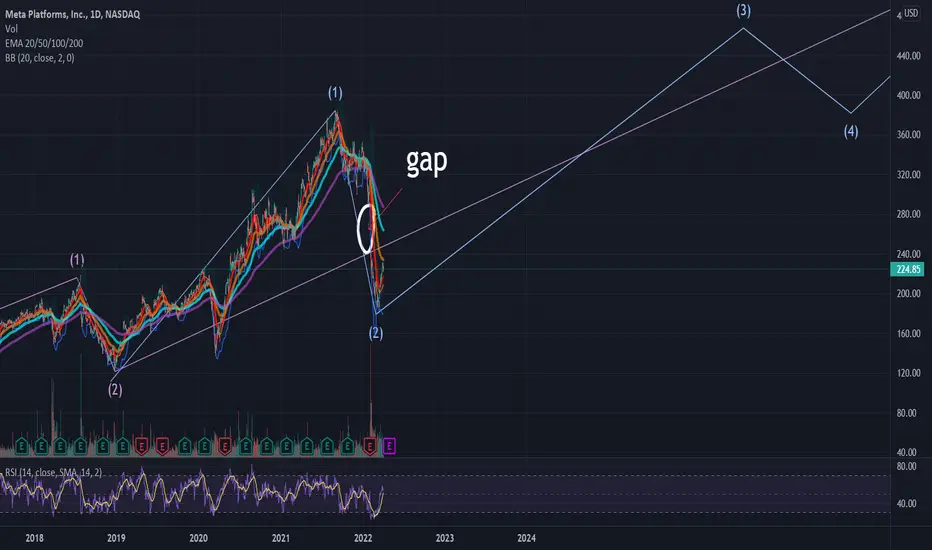
Testing/tracking elliot wave theory. Please do not trade off idea without S/L. Not financial advice.
There's a huge gap around $245-285. I don't normally chart stocks so I have no idea on how long this chart may take to play out.
There's a huge gap around $245-285. I don't normally chart stocks so I have no idea on how long this chart may take to play out.
交易开始
Chart update from the daily to weekly. I've added macro counts and changed the purple wave to green. Recently we touched the oversold area in which we haven't been at since 2013. The last time we were here, we went up for another 6 years. History often repeat itself, will it happen again? 
免责声明
这些信息和出版物并非旨在提供,也不构成TradingView提供或认可的任何形式的财务、投资、交易或其他类型的建议或推荐。请阅读使用条款了解更多信息。