做多
Elliott Wave View Suggest Another Push Higher In Facebook
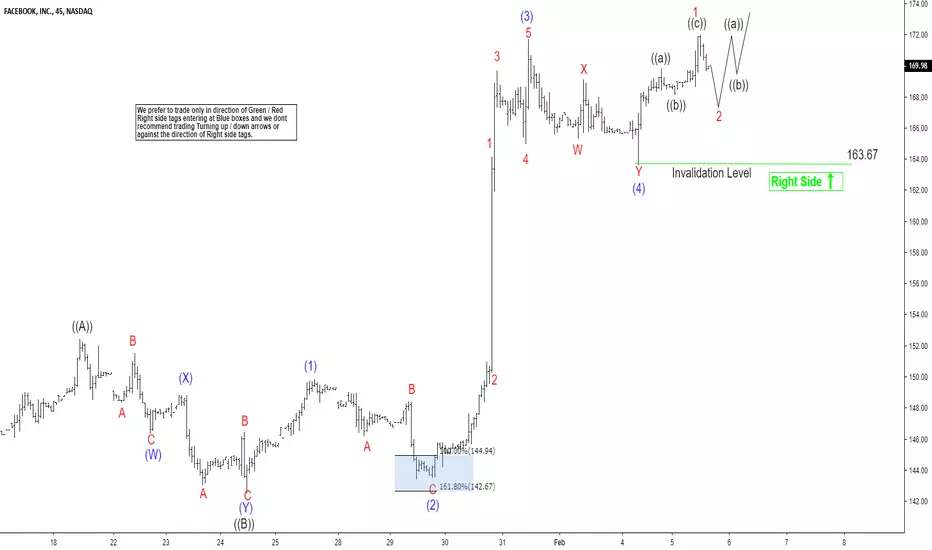
Elliott wave view in Facebook (ticker symbol:  FB) suggests that the rally from December 24.2018 low ($122.55) is unfolding as Elliott wave zigzag structure. The first leg of a zigzag structure ended in wave ((A)) at $152.43 high. Down from there, wave ((B)) pullback unfolded as double three structure where wave (W) ended at $146.37 low. Wave (X) bounce ended at $148.80 high and wave (Y) of ((B)) ended at $142.52 low. A zigzag structure is a 5-3-5 structure where wave ((A)) & ((C)) can unfold as an impulse or a diagonal structures.
In Facebook case, the wave ((C)) is taking a form of an impulse structure where wave (1) ended at $149.83. Wave (2) pullback ended at $143.46 low in lesser degree zigzag structure. Wave (3) ended at $171.68 high in lesser degree 5 waves structure. And wave (4) pullback unfolded as double three structure where wave W ended at $165.35 low. Wave X bounce ended at $169.10 high and wave Y of (4) ended at $163.67 low.
While above there, the stock is expected to resume the upside 1 more time in wave (5) towards $172.61-$191.13 100%-161.8% Fibonacci extension area of ((A))-((B)) before it ends the zigzag structure & turns lower again or pull back in 3 swings at least. Near-term, while above $1163.67 low, expect Facebook to extend higher.
FB) suggests that the rally from December 24.2018 low ($122.55) is unfolding as Elliott wave zigzag structure. The first leg of a zigzag structure ended in wave ((A)) at $152.43 high. Down from there, wave ((B)) pullback unfolded as double three structure where wave (W) ended at $146.37 low. Wave (X) bounce ended at $148.80 high and wave (Y) of ((B)) ended at $142.52 low. A zigzag structure is a 5-3-5 structure where wave ((A)) & ((C)) can unfold as an impulse or a diagonal structures.In Facebook case, the wave ((C)) is taking a form of an impulse structure where wave (1) ended at $149.83. Wave (2) pullback ended at $143.46 low in lesser degree zigzag structure. Wave (3) ended at $171.68 high in lesser degree 5 waves structure. And wave (4) pullback unfolded as double three structure where wave W ended at $165.35 low. Wave X bounce ended at $169.10 high and wave Y of (4) ended at $163.67 low.
While above there, the stock is expected to resume the upside 1 more time in wave (5) towards $172.61-$191.13 100%-161.8% Fibonacci extension area of ((A))-((B)) before it ends the zigzag structure & turns lower again or pull back in 3 swings at least. Near-term, while above $1163.67 low, expect Facebook to extend higher.

免责声明
这些信息和出版物并非旨在提供,也不构成TradingView提供或认可的任何形式的财务、投资、交易或其他类型的建议或推荐。请阅读使用条款了解更多信息。
免责声明
这些信息和出版物并非旨在提供,也不构成TradingView提供或认可的任何形式的财务、投资、交易或其他类型的建议或推荐。请阅读使用条款了解更多信息。