FB bearish or bullish phases
$NASDAQ:FB
Hello everyone 😃
As we can see 👀
- EMA 100 is catching Trend
- DOJI on last candle
- Bearish crossover on MACD
- Bearish Stochastic RSI
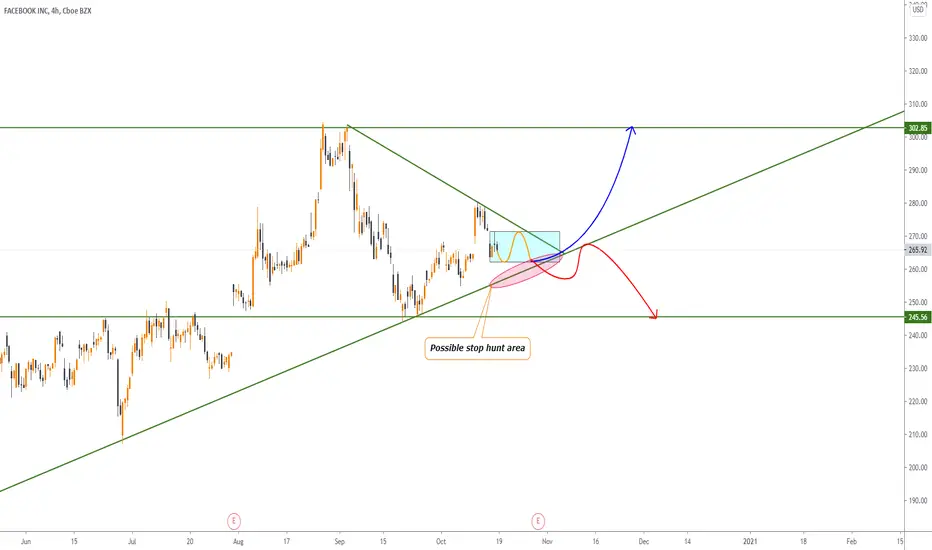
- being range between 262.2 - 271.4 ( mentioned on chart )
IT seems FB wants to break old support but there is a range zone before it !
If FB hold above support we will break triangle from top, then we will turn into Bullish phase...
If FB failed to hold and goes to touch oversell zone, Then we have to stay into bearish phase.
Attention : this is not a financial advise we just try to help people on their own vision.
HAVE A GOOD DAY
- Helical_Trades
Hello everyone 😃
As we can see 👀
- EMA 100 is catching Trend
- DOJI on last candle
- Bearish crossover on MACD
- Bearish Stochastic RSI
- being range between 262.2 - 271.4 ( mentioned on chart )
IT seems FB wants to break old support but there is a range zone before it !
If FB hold above support we will break triangle from top, then we will turn into Bullish phase...
If FB failed to hold and goes to touch oversell zone, Then we have to stay into bearish phase.
Attention : this is not a financial advise we just try to help people on their own vision.
HAVE A GOOD DAY
- Helical_Trades

相关出版物
免责声明
这些信息和出版物并非旨在提供,也不构成TradingView提供或认可的任何形式的财务、投资、交易或其他类型的建议或推荐。请阅读使用条款了解更多信息。