
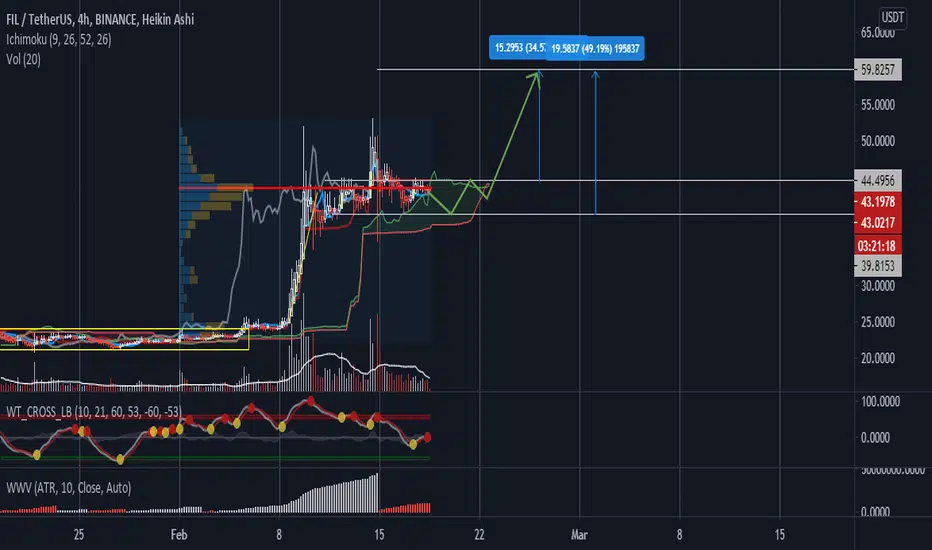
I am looking at FIL in the USDT pair and in a brief analysis I can see an accumulation area that is beginning to show signs of positive disruption.
After a rally that yielded more than 100% gain in value, this asset started to accumulate again (but as the market is sovereign, it can become a distrinution too). So, looking at the volume, I see a decrease in it, which could cause a slight drop before resuming to the bull rally, just as the Weis Wave indicator is still indicating demand on the part of the offer, but in a wave much lower than the previous one.
The WT_CROSS indicator also shows a possible correction before the resumption, just as the Ichimocu Cloud shows me laterality (continuation of accumulation) in the price range between 39,600 and 44,500 USDT which, in my view, would be a good target range description in the graph and target gain percentage.
I emphasize that this is a daydream of mine and it is always good for you to do your own research.

免责声明
这些信息和出版物并非旨在提供,也不构成TradingView提供或认可的任何形式的财务、投资、交易或其他类型的建议或推荐。请阅读使用条款了解更多信息。
免责声明
这些信息和出版物并非旨在提供,也不构成TradingView提供或认可的任何形式的财务、投资、交易或其他类型的建议或推荐。请阅读使用条款了解更多信息。