做多
FLDM: Am I just seeing rounding bottoms everywhere?
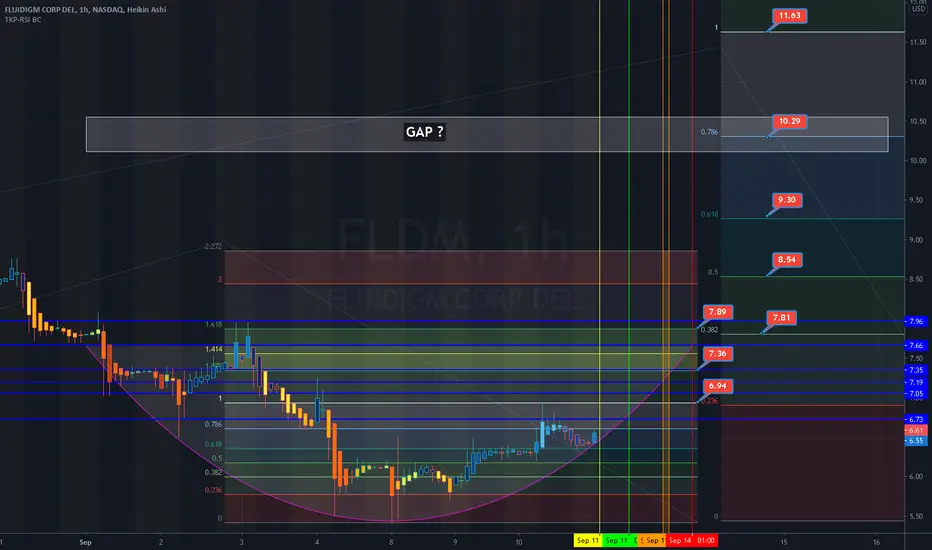
FLDM hourly chart.
Just wanted to publish my chart before it gets cleared, lol.
I think I see a rounding bottom on this sucker.
Also potential gap above.
Blue lines are what I think are res points.
I have short term and long term fibs showing, hopefully charted properly.
The candlesticks are Heikin Ashi.
The candle filler-colors are representative of RSI.
Vertical Lines:
Yellow (pre-market start)
Green (market open)
Orange (power hour/market close/after hours start)
Red (after hours end)
RSI Colors from High to Low:
Bright Green
Green
Dark Green
Light Blue
Dark Blue
Yellow
Orange
Red
Dark Red
Just wanted to publish my chart before it gets cleared, lol.
I think I see a rounding bottom on this sucker.
Also potential gap above.
Blue lines are what I think are res points.
I have short term and long term fibs showing, hopefully charted properly.
The candlesticks are Heikin Ashi.
The candle filler-colors are representative of RSI.
Vertical Lines:
Yellow (pre-market start)
Green (market open)
Orange (power hour/market close/after hours start)
Red (after hours end)
RSI Colors from High to Low:
Bright Green
Green
Dark Green
Light Blue
Dark Blue
Yellow
Orange
Red
Dark Red

免责声明
这些信息和出版物并非旨在提供,也不构成TradingView提供或认可的任何形式的财务、投资、交易或其他类型的建议或推荐。请阅读使用条款了解更多信息。