
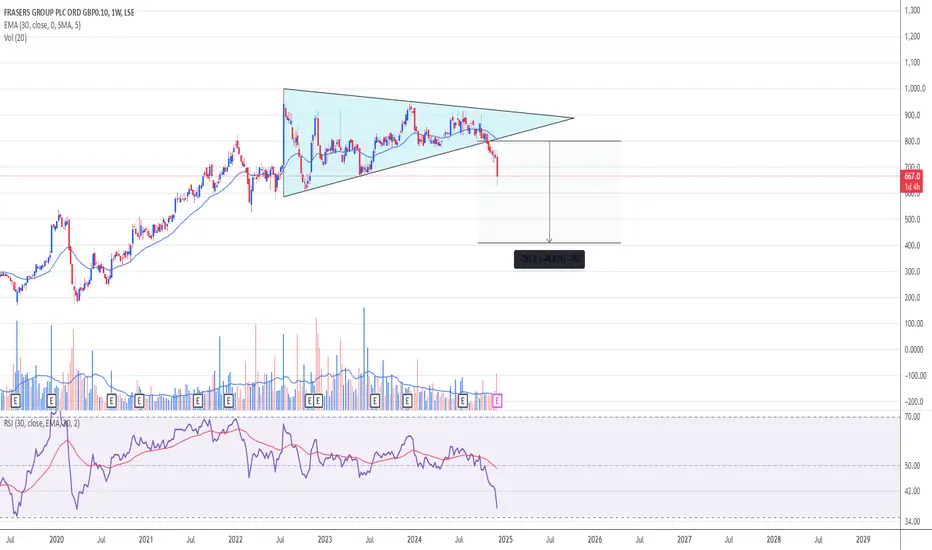
From the bottom of the pandemic they went from 180 to 995.
In Oct 24 they broke to the downside after forming a triangle pattern from July 22 to Oct 24.
There was no indication that the price would break out to the upside from that pattern.
In technical analysis, the target for Shorters would be 409.
GLA and DYOR. This is not a solicitation to hold or trade.
In Oct 24 they broke to the downside after forming a triangle pattern from July 22 to Oct 24.
There was no indication that the price would break out to the upside from that pattern.
In technical analysis, the target for Shorters would be 409.
GLA and DYOR. This is not a solicitation to hold or trade.

免责声明
这些信息和出版物并非旨在提供,也不构成TradingView提供或认可的任何形式的财务、投资、交易或其他类型的建议或推荐。请阅读使用条款了解更多信息。