做多
Frontier (FRONT)
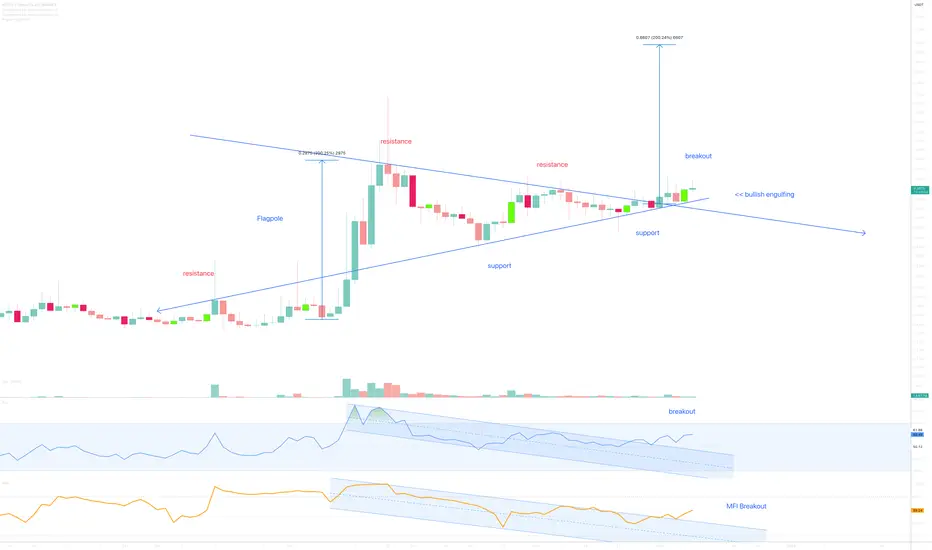
On the above 2-day chart price action has corrected over 60% since the 200% move in September (idea attached). A number of reasons now exist to consider a long position. They include:
1) Price action and RSI resistance breakouts.
2) Price action backtest on past resistance confirms support.
3) Volume. Money Flow resistance breakout. I don’t know why, but more money is flowing in than out.
4) The pennant formation, a reliable chart pattern on confirmation. Price action forecast is determined from taking the flagpole extension to the breakpoint.
Is it possible price action falls further? Sure.
Is it probable? No
Type: Trade
Risk: <=6%
Timeframe for long: Don’t know.
Return: 200%
1) Price action and RSI resistance breakouts.
2) Price action backtest on past resistance confirms support.
3) Volume. Money Flow resistance breakout. I don’t know why, but more money is flowing in than out.
4) The pennant formation, a reliable chart pattern on confirmation. Price action forecast is determined from taking the flagpole extension to the breakpoint.
Is it possible price action falls further? Sure.
Is it probable? No
Type: Trade
Risk: <=6%
Timeframe for long: Don’t know.
Return: 200%
交易开始
Train is departing from Platform $$交易开始
Who FOMO'd in at 50 cents to eat a 30% correction? Whomever it was, I'm guessing a long position is the last thing on their minds right now.10hr - almost too easy.
注释
Think a large move is about to print. Can't say exactly why, just a hunch.Must ask below for updates, not trading this.
Ww
注释
Large move confirmed as per last update.Anyone know how it was forecast?
交易开始
注释
700%注释
150% since the long signal in mid-April 
免责声明
这些信息和出版物并非旨在提供,也不构成TradingView提供或认可的任何形式的财务、投资、交易或其他类型的建议或推荐。请阅读使用条款了解更多信息。