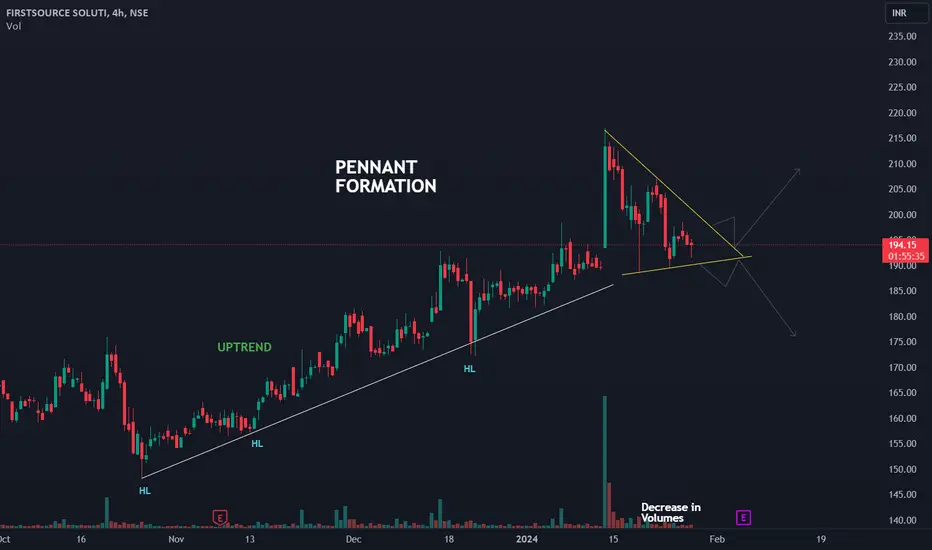
Uptrend Observation:
The first notable aspect of FSL stock is the sustained uptrend it has displayed over a significant period. This bullish movement is characterized by higher highs and higher lows, indicating a strong buying interest in the market.
Identification of Pennant Pattern:
A Pennant is a technical analysis pattern that resembles a small symmetrical triangle, often forming after a strong price movement. The Pennant is typically considered a continuation pattern, suggesting that after a brief consolidation period, the prevailing uptrend is likely to resume.
Key Characteristics of a Pennant:
Pennants are generally short-term patterns, with the consolidation phase lasting anywhere from a few days to a few weeks.
Traders and investors who recognize the Pennant pattern inFSL stock may consider implementing a trading strategy based on a breakout. The breakout occurs when the stock price breaches either the upper or lower trendline of the Pennant pattern.
Long Position: A trader might take a long position if the stock breaks out above the upper trendline, signifying a potential continuation of the uptrend.
Short Position: Conversely, a short position could be considered if the stock breaks below the lower trendline, suggesting a possible reversal or downtrend.
Regardless of the chosen direction, implementing a sound risk management strategy is crucial. Setting a stop-loss order just outside the boundaries of the Pennant pattern can help mitigate potential losses in case the breakout does not follow through as expected.
The first notable aspect of
FSL stock is the sustained uptrend it has displayed over a significant period. This bullish movement is characterized by higher highs and higher lows, indicating a strong buying interest in the market.Identification of Pennant Pattern:
A Pennant is a technical analysis pattern that resembles a small symmetrical triangle, often forming after a strong price movement. The Pennant is typically considered a continuation pattern, suggesting that after a brief consolidation period, the prevailing uptrend is likely to resume.
Key Characteristics of a Pennant:
- Decreasing Volume:
- Duration:
Pennants are generally short-term patterns, with the consolidation phase lasting anywhere from a few days to a few weeks.
Traders and investors who recognize the Pennant pattern in
FSL stock may consider implementing a trading strategy based on a breakout. The breakout occurs when the stock price breaches either the upper or lower trendline of the Pennant pattern.Long Position: A trader might take a long position if the stock breaks out above the upper trendline, signifying a potential continuation of the uptrend.
Short Position: Conversely, a short position could be considered if the stock breaks below the lower trendline, suggesting a possible reversal or downtrend.
Regardless of the chosen direction, implementing a sound risk management strategy is crucial. Setting a stop-loss order just outside the boundaries of the Pennant pattern can help mitigate potential losses in case the breakout does not follow through as expected.

免责声明
这些信息和出版物并非旨在提供,也不构成TradingView提供或认可的任何形式的财务、投资、交易或其他类型的建议或推荐。请阅读使用条款了解更多信息。
免责声明
这些信息和出版物并非旨在提供,也不构成TradingView提供或认可的任何形式的财务、投资、交易或其他类型的建议或推荐。请阅读使用条款了解更多信息。