做多
Can FSR move higher? LONG
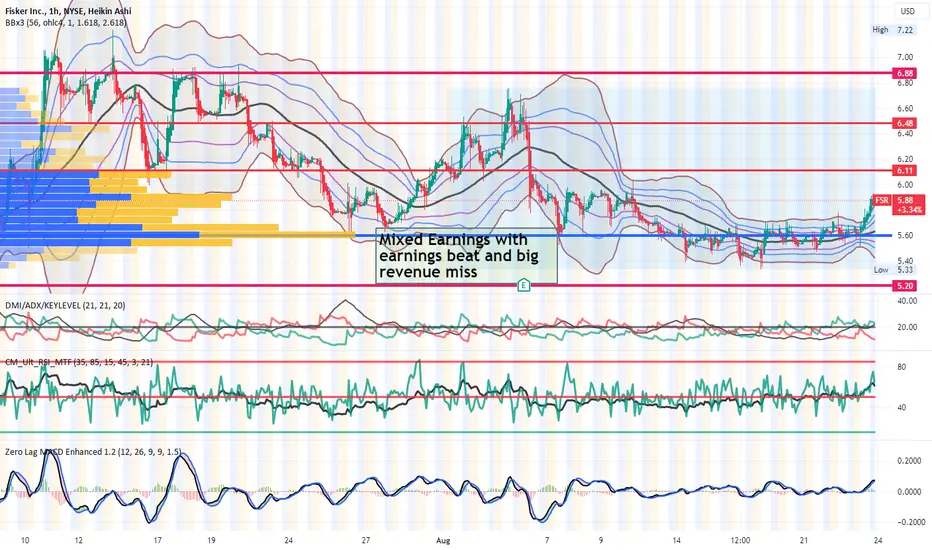
FSR on the one hour chart fell from a triple top in mid July into the lower range
of the volume profile's high volume area then bounced higher in a series of higher
highs but then rolled over and fell again/ It has consolidated sideways about
that POC line and now is above it. The indicators including Directional Index
Zero Lag MACD and dual time frame RSI all indicate a return to bullish momentum.
I will take a long trade the horizontal levels on the chart served as tiered targets
for a risk managed trade. I will take some call options contracts as well. I think FSR
may follow the market leader in TSLA for a bit.
交易开始
Today is another add day.
免责声明
这些信息和出版物并非旨在提供,也不构成TradingView提供或认可的任何形式的财务、投资、交易或其他类型的建议或推荐。请阅读使用条款了解更多信息。
免责声明
这些信息和出版物并非旨在提供,也不构成TradingView提供或认可的任何形式的财务、投资、交易或其他类型的建议或推荐。请阅读使用条款了解更多信息。