Two $FSR opportunities same chart
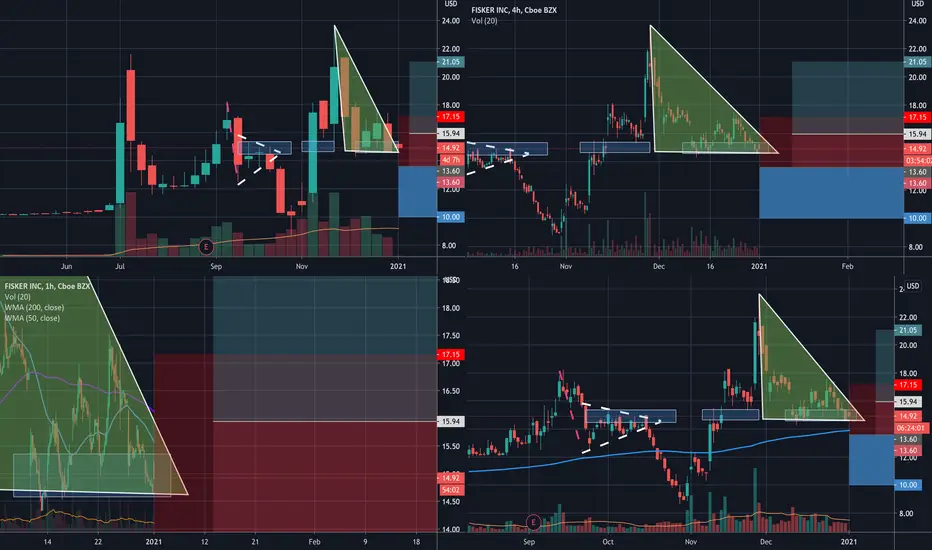
This is what I meant when I say anticipate your opponent.
This chart shows two opposite opportunities. Technically speaking it has a descending triangle which is a bearish pattern. However, as you may notice when price is at $14.50-15.50 range it tends to stall and play around that area. There is better R:R for the long opportunity. For a stock position, waiting on this one and letting price action decide which opportunity to take.
This chart shows two opposite opportunities. Technically speaking it has a descending triangle which is a bearish pattern. However, as you may notice when price is at $14.50-15.50 range it tends to stall and play around that area. There is better R:R for the long opportunity. For a stock position, waiting on this one and letting price action decide which opportunity to take.

免责声明
这些信息和出版物并非旨在提供,也不构成TradingView提供或认可的任何形式的财务、投资、交易或其他类型的建议或推荐。请阅读使用条款了解更多信息。
免责声明
这些信息和出版物并非旨在提供,也不构成TradingView提供或认可的任何形式的财务、投资、交易或其他类型的建议或推荐。请阅读使用条款了解更多信息。