
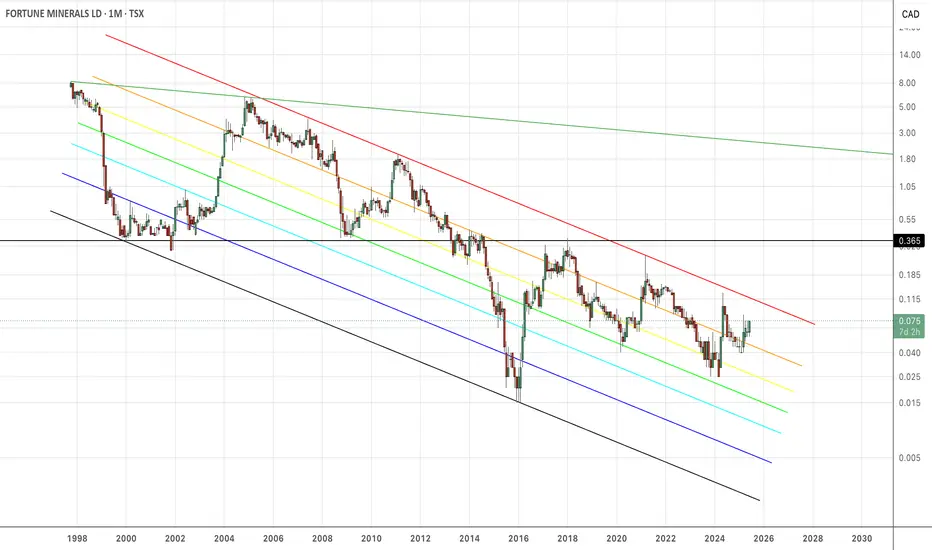
The price is above the moving averages, and the moving averages are all stacked bullish. The situation is a royal flush from a technical perspective. You have these long-standing overheads, with the key linear overhead having already been breached. In Log, we still have the 1-level "bear fib" to clear and then land on top of. Once that lifts off, we run into the .236 "bull Fib" (which I have hidden for simplicity). After we clear the .236 bull fib, it means we are truly bullish in FT for the first time in the chart history. Then come's the $.38CAN level, and higher. It in the states here, I'm looking for $2.
This is the first time the price has come to be supported by the moving averages. First time in chart history. The Bollinger Bands are widening. The OBV is near record high levels. All hell is about to break lose.
This is the first time the price has come to be supported by the moving averages. First time in chart history. The Bollinger Bands are widening. The OBV is near record high levels. All hell is about to break lose.

免责声明
这些信息和出版物并非旨在提供,也不构成TradingView提供或认可的任何形式的财务、投资、交易或其他类型的建议或推荐。请阅读使用条款了解更多信息。