已更新
Fantom (FTM) - November 29
Hello?
Traders, welcome.
If you "Follow", you can always get new information quickly.
Please also click "Boost".
Have a good day.
-------------------------------------
(FTMBTC 1W chart)

It must rise above 0.0000 1374 to gain the strength of the rise.
--------------------------------------
(FTMUSDT 1W chart)

The key question is whether the price can sustain the move above 0.3339.
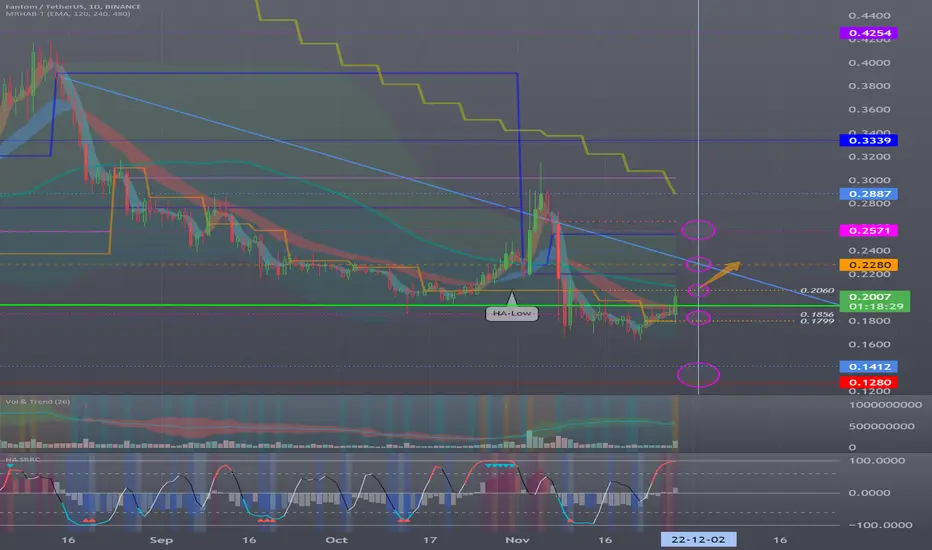
(1D chart)
The key is whether the price can sustain above 0.2280 to break out of the downtrend line.
If not, you should check for support around 0.1799.
-------------------------------------------------- -------------------------------------------
** All descriptions are for reference only and do not guarantee profit or loss in investment.
** If this chart is shared, you can use the indicators normally.
** The MRHAB-T indicator includes indicators that indicate points of support and resistance.
** HA SRRC indicators are displayed as StochRSI (line), RSI (columns), and CCI (bgcolor).
** The CCI indicator is displayed in the overbought section (CCI > +100) and oversold section (CCI < -100).
(Short-term Stop Loss can be said to be a point where profit or loss can be preserved or additional entry can be made by split trading. This is a short-term investment perspective.)
---------------------------------
Traders, welcome.
If you "Follow", you can always get new information quickly.
Please also click "Boost".
Have a good day.
-------------------------------------
(FTMBTC 1W chart)
It must rise above 0.0000 1374 to gain the strength of the rise.
--------------------------------------
(FTMUSDT 1W chart)
The key question is whether the price can sustain the move above 0.3339.
(1D chart)
The key is whether the price can sustain above 0.2280 to break out of the downtrend line.
If not, you should check for support around 0.1799.
-------------------------------------------------- -------------------------------------------
** All descriptions are for reference only and do not guarantee profit or loss in investment.
** If this chart is shared, you can use the indicators normally.
** The MRHAB-T indicator includes indicators that indicate points of support and resistance.
** HA SRRC indicators are displayed as StochRSI (line), RSI (columns), and CCI (bgcolor).
** The CCI indicator is displayed in the overbought section (CCI > +100) and oversold section (CCI < -100).
(Short-term Stop Loss can be said to be a point where profit or loss can be preserved or additional entry can be made by split trading. This is a short-term investment perspective.)
---------------------------------
注释
(FTMBUSD 1D chart)
[Practical trading strategy using HA-MS and SBOD]
youtu.be/aceN1AttX1Y
[Web Site]
readcrypto.kr
- Chart pattern analysis has been added.
youtu.be/aceN1AttX1Y
[Web Site]
readcrypto.kr
- Chart pattern analysis has been added.
相关出版物
免责声明
这些信息和出版物并非旨在提供,也不构成TradingView提供或认可的任何形式的财务、投资、交易或其他类型的建议或推荐。请阅读使用条款了解更多信息。
[Practical trading strategy using HA-MS and SBOD]
youtu.be/aceN1AttX1Y
[Web Site]
readcrypto.kr
- Chart pattern analysis has been added.
youtu.be/aceN1AttX1Y
[Web Site]
readcrypto.kr
- Chart pattern analysis has been added.
相关出版物
免责声明
这些信息和出版物并非旨在提供,也不构成TradingView提供或认可的任何形式的财务、投资、交易或其他类型的建议或推荐。请阅读使用条款了解更多信息。