FTM ""Double Bottom"" Weekly Chart
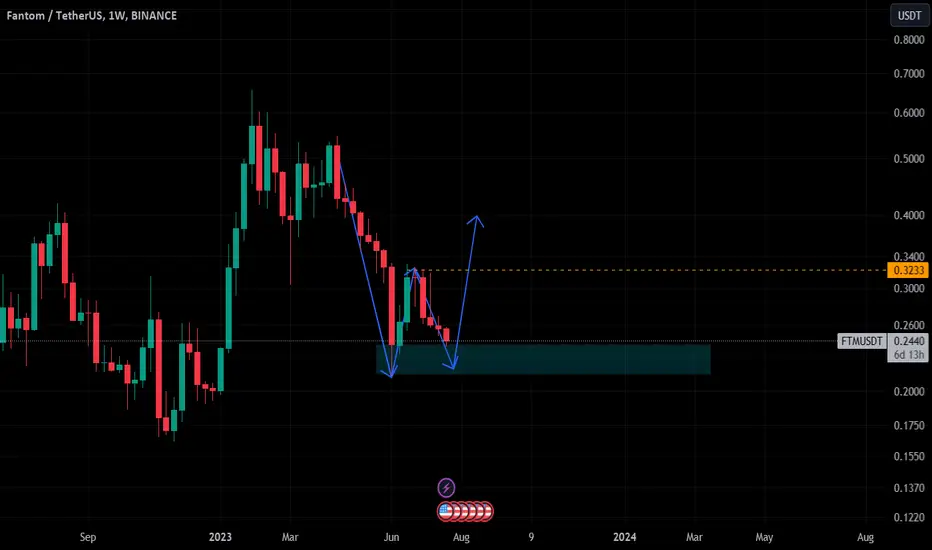
FTM is looking great as it is also forming a double bottom on weekly timeframe. The higher the timeframe the better it is.
It also started to form bullish divergence on 4h timeframe as shared in the previous idea.
We need to wait for the BREAK and RETEST of the NECKLINE marked with orange dotted line.
LETS PUMP IT !!
DYOR, NFA
It also started to form bullish divergence on 4h timeframe as shared in the previous idea.
We need to wait for the BREAK and RETEST of the NECKLINE marked with orange dotted line.
LETS PUMP IT !!
DYOR, NFA

免责声明
这些信息和出版物并非旨在提供,也不构成TradingView提供或认可的任何形式的财务、投资、交易或其他类型的建议或推荐。请阅读使用条款了解更多信息。