FTX Token Chart Mapped | Resistance & Support Levels
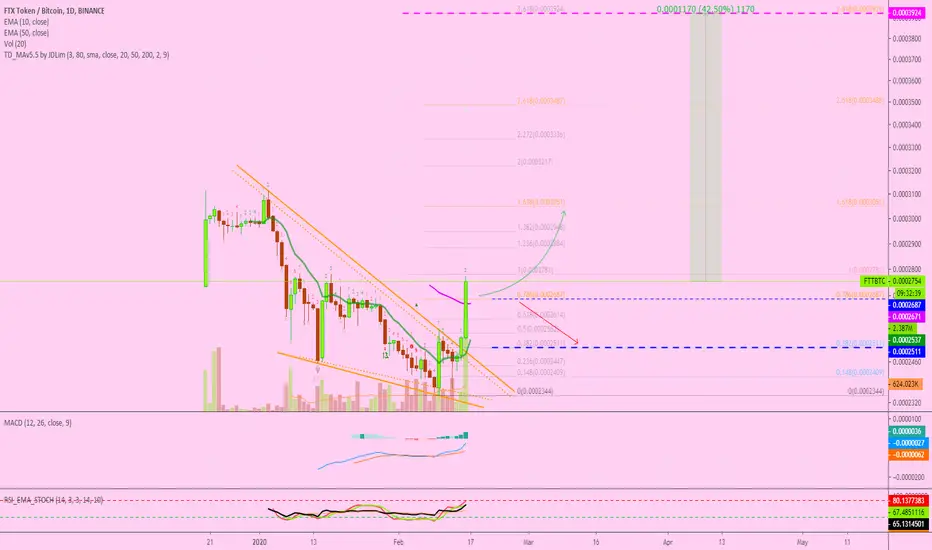
Here we have for you the FTTBTC (FTX Token) chart with Fibonacci support and resistance levels mapped.
FTX Token (FTTBTC) Chart Analysis by Alan Masters
Here we have a very strong/bullish chart.
FTX Token can easily continue to grow...
Make sure to hit LIKE if you enjoyed this post.
Thanks a lot for reading.
Namaste.
FTX Token (FTTBTC) Chart Analysis by Alan Masters
Here we have a very strong/bullish chart.
- Prices for FTTBTC are now trading above EMA50 on really high volume. With a strong daily candle close (closing at 0.00002690 or higher), FTTBTC can continue straight up.
- The RSI is bullish sitting at 65.
- The MACD is trending up and gaining momentum.
- Full bullish candle today.
- Broken falling wedge.
- Bullish Cryptocurrency Market.
FTX Token can easily continue to grow...
Make sure to hit LIKE if you enjoyed this post.
Thanks a lot for reading.
Namaste.

✅ Cryptocurrencies technical analysis & results
t.me/masteranandatrades/9279
✅ Stocks technical analysis
t.me/anandastocks
✅ Enjoyed the content? Join my PREMIUM channels for more... t.me/lamatrades/4 (since 2017)
t.me/masteranandatrades/9279
✅ Stocks technical analysis
t.me/anandastocks
✅ Enjoyed the content? Join my PREMIUM channels for more... t.me/lamatrades/4 (since 2017)
相关出版物
免责声明
这些信息和出版物并非旨在提供,也不构成TradingView提供或认可的任何形式的财务、投资、交易或其他类型的建议或推荐。请阅读使用条款了解更多信息。
✅ Cryptocurrencies technical analysis & results
t.me/masteranandatrades/9279
✅ Stocks technical analysis
t.me/anandastocks
✅ Enjoyed the content? Join my PREMIUM channels for more... t.me/lamatrades/4 (since 2017)
t.me/masteranandatrades/9279
✅ Stocks technical analysis
t.me/anandastocks
✅ Enjoyed the content? Join my PREMIUM channels for more... t.me/lamatrades/4 (since 2017)
相关出版物
免责声明
这些信息和出版物并非旨在提供,也不构成TradingView提供或认可的任何形式的财务、投资、交易或其他类型的建议或推荐。请阅读使用条款了解更多信息。