
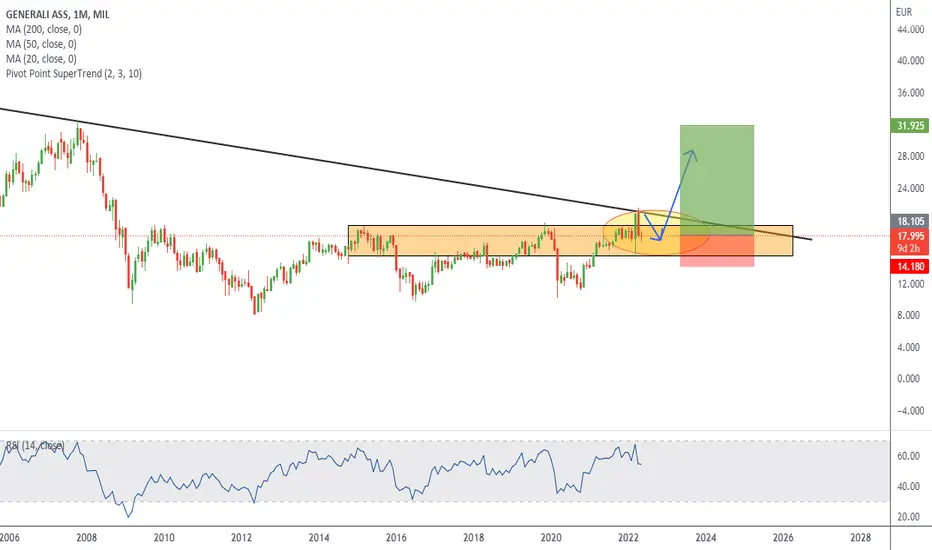
For having a better understading of what is happening on this stock about my last idea, on the Montly chart we see a clear break of structure and a retest of it after testing an important trendline(formed in Oct 07).The price has been bouncing over the last 12 years and now finally we see a strong candle formed in March this year breaking all structure and showing us bullish pressure. We can expect more bullish continuation the next months if price manage to break this trendline. Important monitoring price action in lower timeframes.

免责声明
这些信息和出版物并非旨在提供,也不构成TradingView提供或认可的任何形式的财务、投资、交易或其他类型的建议或推荐。请阅读使用条款了解更多信息。
免责声明
这些信息和出版物并非旨在提供,也不构成TradingView提供或认可的任何形式的财务、投资、交易或其他类型的建议或推荐。请阅读使用条款了解更多信息。