
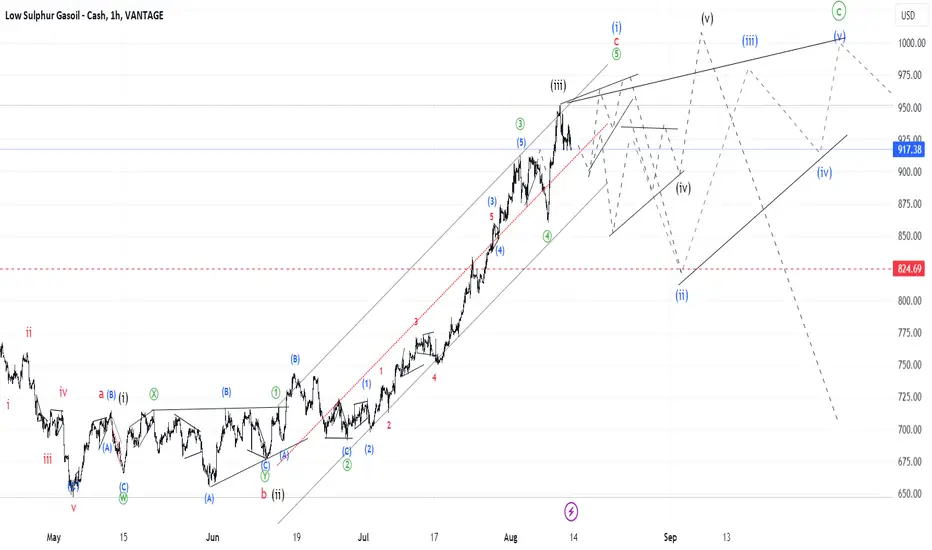
The Gasoil chart also has several alternatives to how it can shape the end of the uptrend. I indicated them on the chart below. Black labels mark the alternative scenario. Probability is not much different from each other. In summary, we have to prepare for a volatile environment which would be difficult to orientate until it is over and wave [c] of X is formed.

免责声明
这些信息和出版物并非旨在提供,也不构成TradingView提供或认可的任何形式的财务、投资、交易或其他类型的建议或推荐。请阅读使用条款了解更多信息。
免责声明
这些信息和出版物并非旨在提供,也不构成TradingView提供或认可的任何形式的财务、投资、交易或其他类型的建议或推荐。请阅读使用条款了解更多信息。