

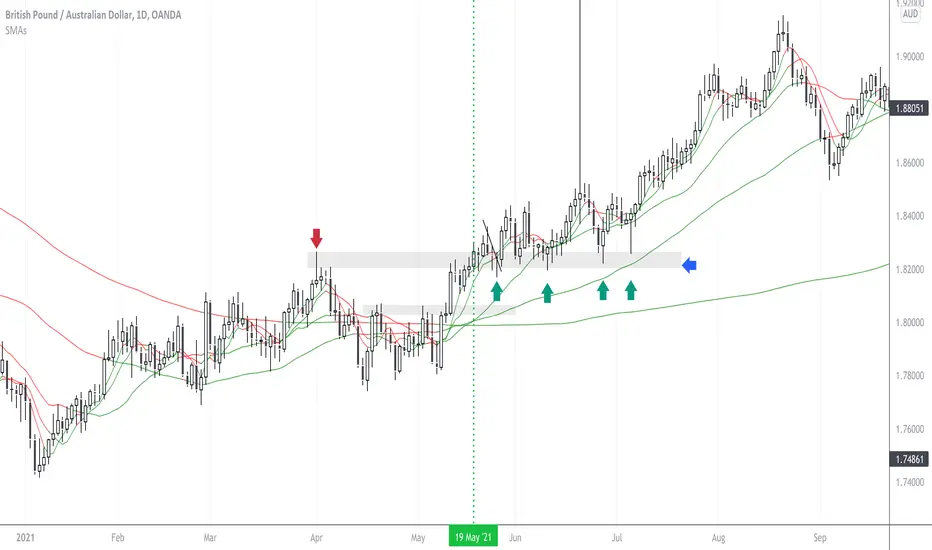
We start by creating a visual for when all moving averages are in order and across the 200 moving average. In this example, I have used a vertical line in the colour of our bias direction, Long(Green), when this condition has been met. We now have an increased confidence by filtering out trade setups that do not meet our bias giving a higher probability and focus.
Levels of previous resistance give us a price that we can enter the market by turning into a new level of support. In this example I have highlighted this with a red arrow located on the left hand side.
Now we have a trading bias and a methodology to set price restrictions to enter the market, we can now trade only long positions and trade setups. In this example I have highlighted long opportunities that have been triggered with arrows in green located on the right hand side. Entry points can be executed on either the daily, 4hour or 1hour charts depending on risk and trading style preference. Please note - Lower time frames may generate more signals which presents more risk.
Levels of previous resistance give us a price that we can enter the market by turning into a new level of support. In this example I have highlighted this with a red arrow located on the left hand side.
Now we have a trading bias and a methodology to set price restrictions to enter the market, we can now trade only long positions and trade setups. In this example I have highlighted long opportunities that have been triggered with arrows in green located on the right hand side. Entry points can be executed on either the daily, 4hour or 1hour charts depending on risk and trading style preference. Please note - Lower time frames may generate more signals which presents more risk.

免责声明
这些信息和出版物并非旨在提供,也不构成TradingView提供或认可的任何形式的财务、投资、交易或其他类型的建议或推荐。请阅读使用条款了解更多信息。