

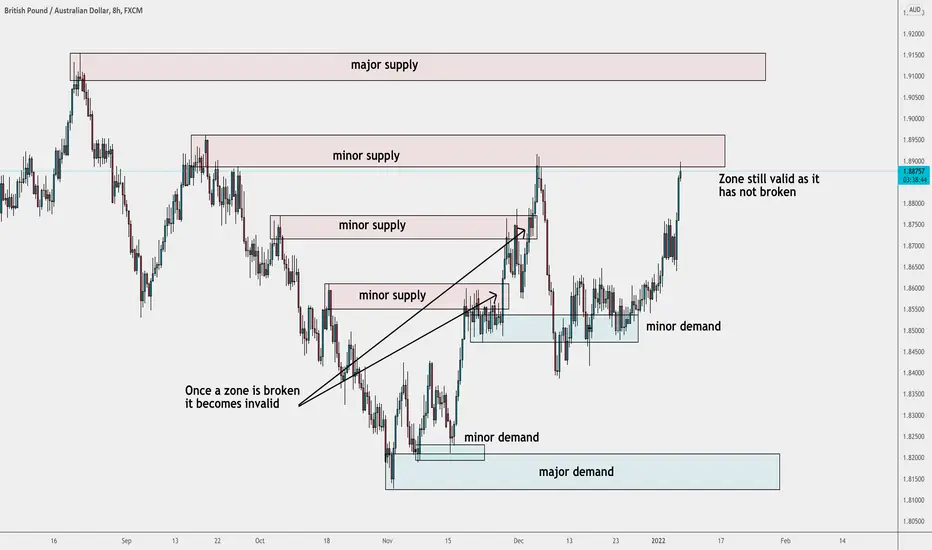
As we can see above i have demonstrated how supply and demand zones can be used to help you analyse a chart.
Firstly we need to identify an absolute high and and absolute low on the TF we are using. The higher the TF the more valid the zones become. When the absolute highs and lows are identified, they are what we know as the major supply and demand and we will expect the greatest reactions to happen around them.
As the chart also shows, price will create sets of highs and lows in between the majors and they are what will become the MINOR supplies and demands. These zones can be looked at as reaction points, however once the price breaks through them they become invalid.
This is just a very brief way of looking at zones in order to help you analyse a chart.
Firstly we need to identify an absolute high and and absolute low on the TF we are using. The higher the TF the more valid the zones become. When the absolute highs and lows are identified, they are what we know as the major supply and demand and we will expect the greatest reactions to happen around them.
As the chart also shows, price will create sets of highs and lows in between the majors and they are what will become the MINOR supplies and demands. These zones can be looked at as reaction points, however once the price breaks through them they become invalid.
This is just a very brief way of looking at zones in order to help you analyse a chart.

免责声明
这些信息和出版物并非旨在提供,也不构成TradingView提供或认可的任何形式的财务、投资、交易或其他类型的建议或推荐。请阅读使用条款了解更多信息。
免责声明
这些信息和出版物并非旨在提供,也不构成TradingView提供或认可的任何形式的财务、投资、交易或其他类型的建议或推荐。请阅读使用条款了解更多信息。