

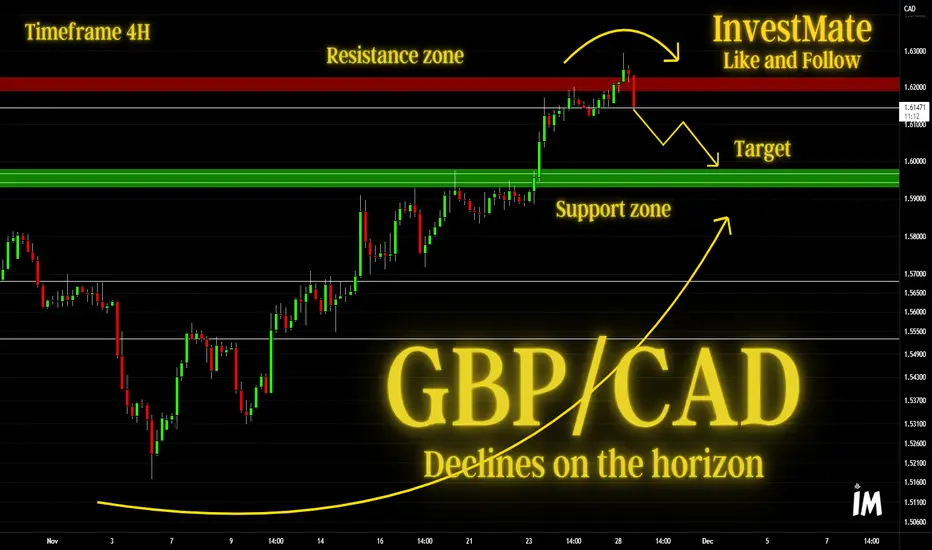
💷GBP/CAD Declines on the horizon.
💷This time it's time for GBP/CAD which, in my opinion, gave us a clear signal today on the direction it wants to go in for the next few days.
💷Just look at today's downtrend candle which stands out from the rest in terms of size. And Everything becomes clear.
💷 As you can see, the price has just fallen to the fibo level of 0.786 of the entire upward wave from the 2010 bottom to the 2015 peak. I don't think it represents strong support looking at the dynamics with which we are moving.
💷 The key support will be the zone defined on the chart based on the cluster of two levels. The first level is the fibo level of the entire upward wave from the 1985 bottom to the 1998 peak and the second level is the 1976 bottom.
💷It will be really interesting to see how the price reacts in this support zone.
💷I determined the resistance zone based on the price levels that have provided resistance to the price in the past.
💷The scenario I am playing out is a continuation of the declines to the support zone where I will watch to see how the price will behave. I am aware of the possibility of a correction at any time, this should be taken into account, If the outlook would change I will publish a post with an update, so I encourage you to actively follow the profile and read the description carefully.
💷 *Please do not suggest the path I have drawn with the lines this is only a hypothetical scenario.
🚀If you appreciate my work and effort put into this post I encourage you to leave a like and give a follow on my profile.🚀

💷This time it's time for GBP/CAD which, in my opinion, gave us a clear signal today on the direction it wants to go in for the next few days.
💷Just look at today's downtrend candle which stands out from the rest in terms of size. And Everything becomes clear.
💷 As you can see, the price has just fallen to the fibo level of 0.786 of the entire upward wave from the 2010 bottom to the 2015 peak. I don't think it represents strong support looking at the dynamics with which we are moving.
💷 The key support will be the zone defined on the chart based on the cluster of two levels. The first level is the fibo level of the entire upward wave from the 1985 bottom to the 1998 peak and the second level is the 1976 bottom.
💷It will be really interesting to see how the price reacts in this support zone.
💷I determined the resistance zone based on the price levels that have provided resistance to the price in the past.
💷The scenario I am playing out is a continuation of the declines to the support zone where I will watch to see how the price will behave. I am aware of the possibility of a correction at any time, this should be taken into account, If the outlook would change I will publish a post with an update, so I encourage you to actively follow the profile and read the description carefully.
💷 *Please do not suggest the path I have drawn with the lines this is only a hypothetical scenario.
🚀If you appreciate my work and effort put into this post I encourage you to leave a like and give a follow on my profile.🚀

🌌🌌🌌🌌🌌🌌🌌🌌🌌🌌🌌🌌🌌🌌🌌🌌🌌🌌🌌🌌🌌🌌🌌🌌🌌🌌🌌
💲 To keep up to date with all my activities I invite you to visit my Telegram 💲
💲 t.me/Investmatez 💲
🌌🌌🌌🌌🌌🌌🌌🌌🌌🌌🌌🌌🌌🌌🌌🌌🌌🌌🌌🌌🌌🌌🌌🌌🌌🌌🌌
💲 To keep up to date with all my activities I invite you to visit my Telegram 💲
💲 t.me/Investmatez 💲
🌌🌌🌌🌌🌌🌌🌌🌌🌌🌌🌌🌌🌌🌌🌌🌌🌌🌌🌌🌌🌌🌌🌌🌌🌌🌌🌌
免责声明
这些信息和出版物并非旨在提供,也不构成TradingView提供或认可的任何形式的财务、投资、交易或其他类型的建议或推荐。请阅读使用条款了解更多信息。
🌌🌌🌌🌌🌌🌌🌌🌌🌌🌌🌌🌌🌌🌌🌌🌌🌌🌌🌌🌌🌌🌌🌌🌌🌌🌌🌌
💲 To keep up to date with all my activities I invite you to visit my Telegram 💲
💲 t.me/Investmatez 💲
🌌🌌🌌🌌🌌🌌🌌🌌🌌🌌🌌🌌🌌🌌🌌🌌🌌🌌🌌🌌🌌🌌🌌🌌🌌🌌🌌
💲 To keep up to date with all my activities I invite you to visit my Telegram 💲
💲 t.me/Investmatez 💲
🌌🌌🌌🌌🌌🌌🌌🌌🌌🌌🌌🌌🌌🌌🌌🌌🌌🌌🌌🌌🌌🌌🌌🌌🌌🌌🌌
免责声明
这些信息和出版物并非旨在提供,也不构成TradingView提供或认可的任何形式的财务、投资、交易或其他类型的建议或推荐。请阅读使用条款了解更多信息。