

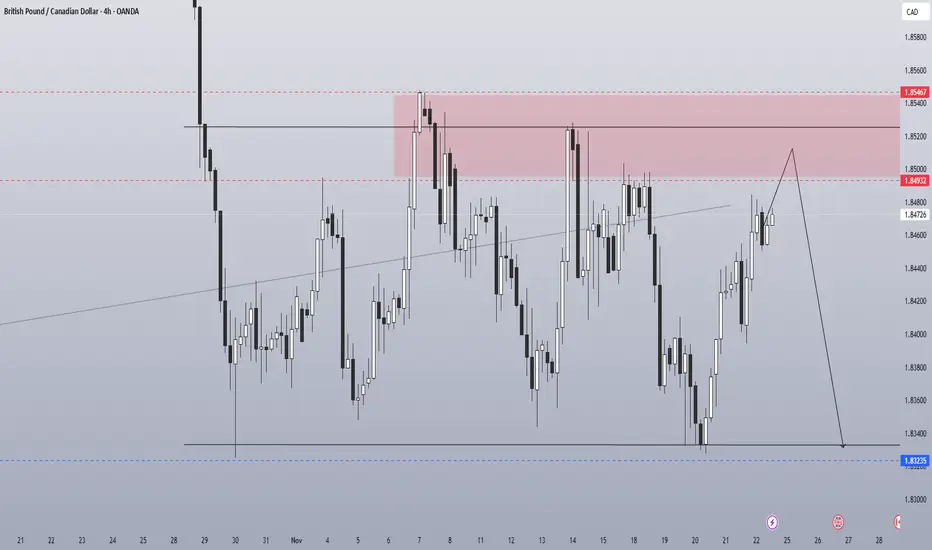
Winlouh chart is very clean: it clearly outlines a premium supply zone, an ascending corrective structure below it, and a projected strong downward move toward the 1.83325 liquidity level.
Let’s break it down.
Let’s break it down.

✅FREE FOREX &CRYPTO SIGNALS TELEGRAM CHANNEL:
t.me/winlouhscalperchannel
t.me/winlouhscalperchannel
免责声明
这些信息和出版物并非旨在提供,也不构成TradingView提供或认可的任何形式的财务、投资、交易或其他类型的建议或推荐。请阅读使用条款了解更多信息。
✅FREE FOREX &CRYPTO SIGNALS TELEGRAM CHANNEL:
t.me/winlouhscalperchannel
t.me/winlouhscalperchannel
免责声明
这些信息和出版物并非旨在提供,也不构成TradingView提供或认可的任何形式的财务、投资、交易或其他类型的建议或推荐。请阅读使用条款了解更多信息。