

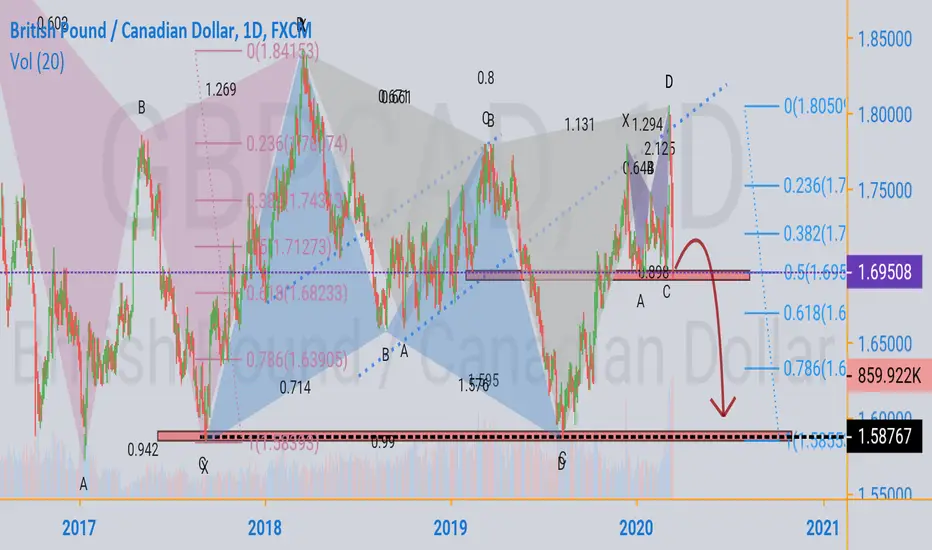
The first harmonic pattern in the picture, which is bearish gartley (the letter W, pink), we can see the price fell around 70% retracement of the projected height of foot C to D. Maybe for moderate traders, they will target the profit on foot C (100%), then ... Yeah, the price touched that level.
The next harmonic pattern, which is bullish gartley (letter M, blue), prices even went up more than 100% retracement of the projected height of foot C to D.
The third one, bearish chyper harmonic pattern (the letter W, gray color), the price is currently falling 50% of the projected height of foot C to D. On it, we see a smaller harmonic pattern, which is bearish butterfly, which in this pattern the price is falling already 100% of the projected foot height C to D.
Overall in the picture, we can conclude that the existing condition is sideways. In sideways conditions price can move anywhere irregularly, but within the limits of the lowest support and highest resistance.
I predicted that price would continue fall to the lowest support point based on price action that is formed. From the candle side, we can see the dominance of the bearish followed by strong liquid volume. In terms of the third harmonic pattern, the price is still in the position of 50% retracement, the target can be 100% in a sideways condition.
Note: I don't give buy and sell signals. All my posts are just ideas. If you want to apply, do your own analysis first, make sure it matches your analysis. If not, then just trash this idea. So that you won't disappointed and blame the other party when everything does not fit the analysis.
The next harmonic pattern, which is bullish gartley (letter M, blue), prices even went up more than 100% retracement of the projected height of foot C to D.
The third one, bearish chyper harmonic pattern (the letter W, gray color), the price is currently falling 50% of the projected height of foot C to D. On it, we see a smaller harmonic pattern, which is bearish butterfly, which in this pattern the price is falling already 100% of the projected foot height C to D.
Overall in the picture, we can conclude that the existing condition is sideways. In sideways conditions price can move anywhere irregularly, but within the limits of the lowest support and highest resistance.
I predicted that price would continue fall to the lowest support point based on price action that is formed. From the candle side, we can see the dominance of the bearish followed by strong liquid volume. In terms of the third harmonic pattern, the price is still in the position of 50% retracement, the target can be 100% in a sideways condition.
Note: I don't give buy and sell signals. All my posts are just ideas. If you want to apply, do your own analysis first, make sure it matches your analysis. If not, then just trash this idea. So that you won't disappointed and blame the other party when everything does not fit the analysis.

免责声明
这些信息和出版物并非旨在提供,也不构成TradingView提供或认可的任何形式的财务、投资、交易或其他类型的建议或推荐。请阅读使用条款了解更多信息。