

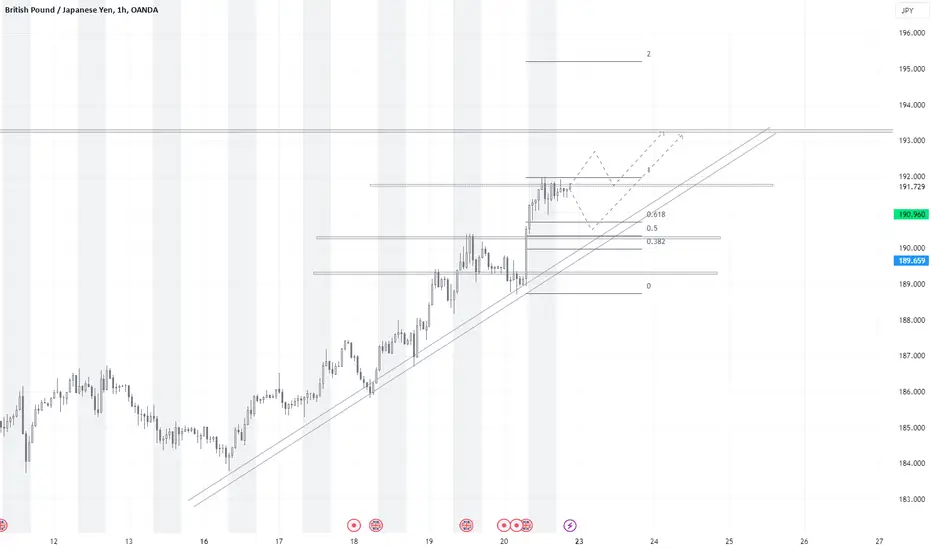
I'm tracking GBP/JPY on the 1-hour chart. The pair has been trading within a well-defined ascending channel and is approaching key resistance levels.
I’ve plotted Fibonacci levels to watch for potential corrections. Price is hovering around the 61.8% retracement, which is often a significant support zone. Price continues to respect the upward trendline, which reinforces the bullish momentum as long as it holds.
The next level of interest is around 193.00, aligning with channel resistance and key horizontal levels. If the price breaks above this area, it could head higher toward 194.50.
If the price breaks below the trendline, I’ll be looking at the 50% Fibonacci level as a possible next support at 190.00.
Overall, I'm bullish for now, but cautious of a potential retracement if the price fails to break out of the channel.
I’ve plotted Fibonacci levels to watch for potential corrections. Price is hovering around the 61.8% retracement, which is often a significant support zone. Price continues to respect the upward trendline, which reinforces the bullish momentum as long as it holds.
The next level of interest is around 193.00, aligning with channel resistance and key horizontal levels. If the price breaks above this area, it could head higher toward 194.50.
If the price breaks below the trendline, I’ll be looking at the 50% Fibonacci level as a possible next support at 190.00.
Overall, I'm bullish for now, but cautious of a potential retracement if the price fails to break out of the channel.

免责声明
这些信息和出版物并非旨在提供,也不构成TradingView提供或认可的任何形式的财务、投资、交易或其他类型的建议或推荐。请阅读使用条款了解更多信息。